Another Look at the Correlation Between Google Trends and Initial Unemployment Insurance Claims
In a previous Chicago Fed Insights blog post, we took a closer look at what drives the correlation between Google Trends unemployment topic indexes1 and state initial unemployment insurance (UI) claims at the U.S. metro area level. We found that the positive correlation between Google search intensity for unemployment-related terms and the rate of UI take-up during the Covid-19 pandemic was primarily driven by variation within U.S. metro areas across time (the time series dimension) and less so by variation across U.S. metro areas within weeks (the cross-sectional dimension). In this blog post, we examine how this correlation during the current recession compares with the correlation during the previous recession. We find that differences in the correlations across the two recessions can mostly be explained by the federal Pandemic Unemployment Assistance (PUA) program.
California metro area UI claims past and present
To examine this correlation during the two most recent recessions at the metro area level, we use the state of California as a case study. California is unique in that we can obtain monthly county-level initial UI claims from its state government (via Haver Analytics) over a time period spanning both recessions. As in our previous post, we add to these data Google Trends unemployment topic indexes normalized against the national index at the designated market area (DMA) level, which is the smallest level of geographic disaggregation available that is consistent with the county-level UI claims data.2 Then, we aggregate the county-level UI claims data up to the DMA level to obtain a consistent metro-area-by-month panel of data for California.
Figure 1 shows a map of initial UI claims per 1,000 residents for California at four different points in time. Panels A and B of the figure are for the months of December 2007 and June 2009, which correspond to the peak and trough months of the Great Recession, as defined by the National Bureau of Economic Research (NBER).3 Panels C and D of the figure are for the months of February 2020—the peak of the most recent NBER-defined business cycle for the U.S.—and May 2020—the last full month for which we have UI claims data for California. There are several interesting features of these maps, but the one that really stands out is the large amount of heterogeneity in the labor market conditions of California metro areas both within and across time periods. It is this heterogeneity that we seek to understand with the Google Trends data.
Figure 1. Initial UI claims per 1,000 residents for metro areas in California
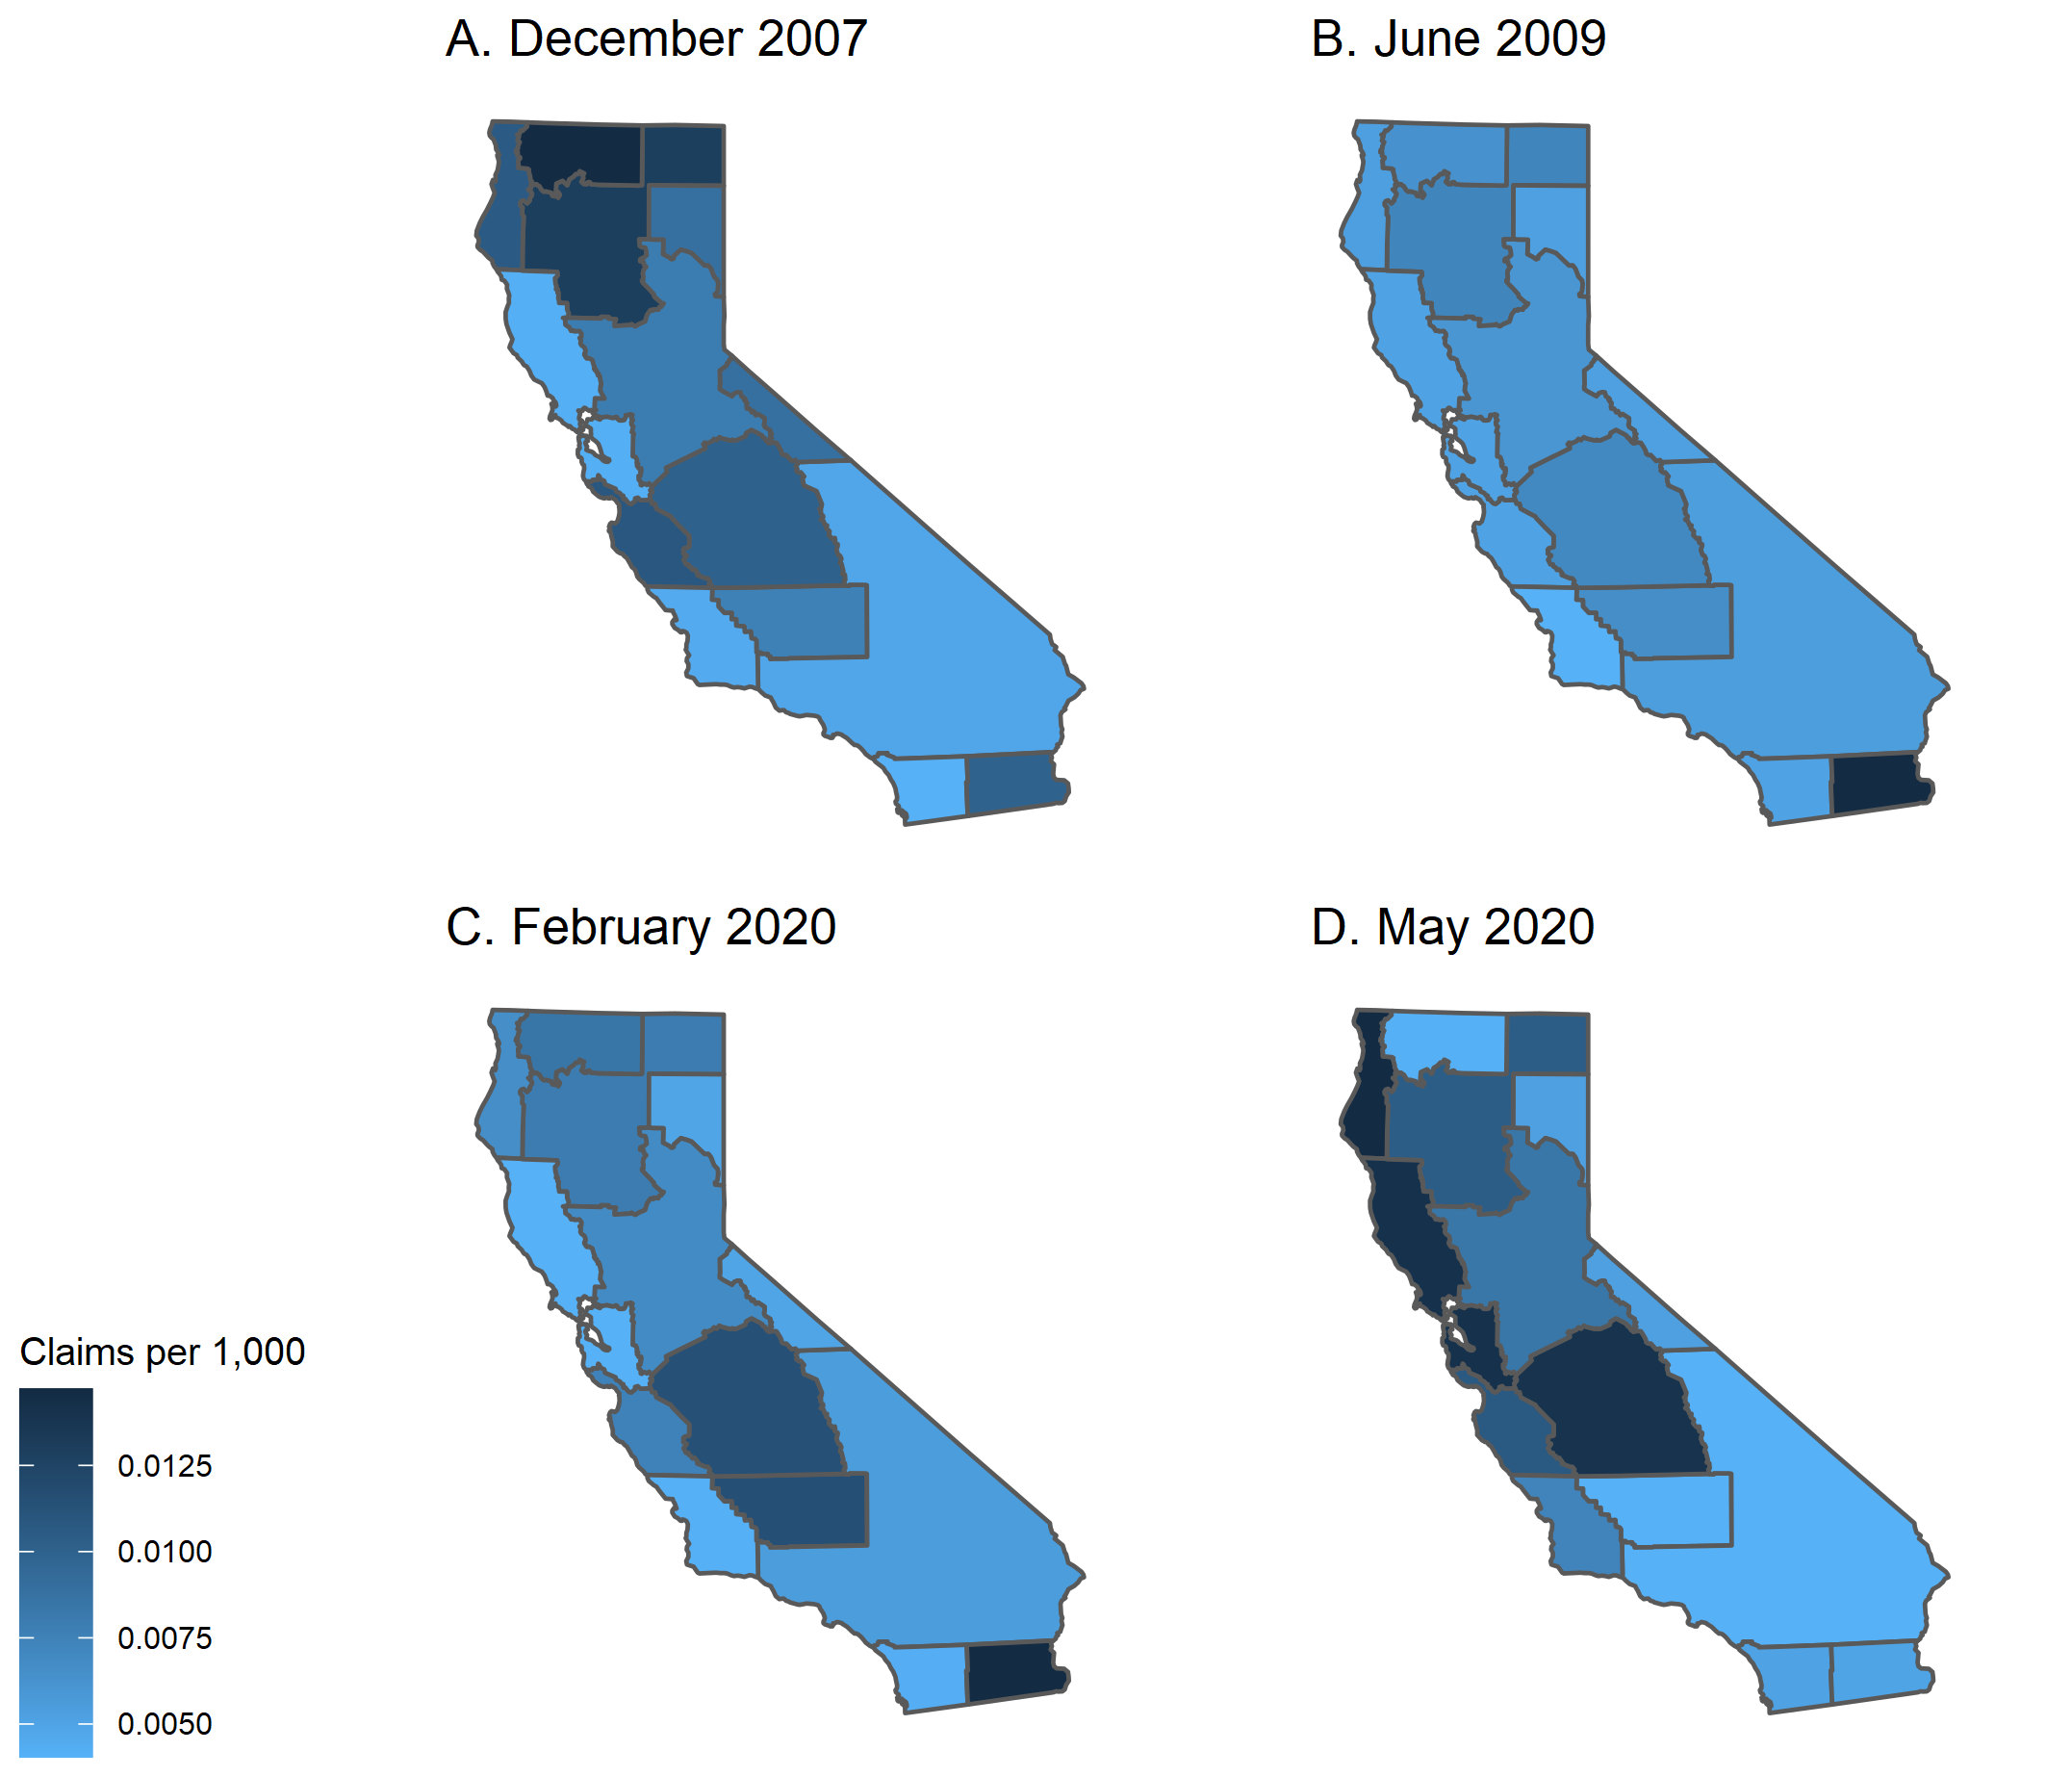
Sources: Authors’ calculations based on data from the State of California and U.S. Census Bureau from Haver Analytics.
Google Trends and California metro area initial UI claims
The five linear regressions4 in table 1 each represent different ways of summarizing the relationship between Google search intensity for unemployment-related terms and initial UI claims in California since 2007. Each regresses (log) initial UI claims (the dependent variable) on (log) search intensity as captured by the Google Trends unemployment topic indexes (the independent variable), weighted by population. They are different, however, in the way in which they control for metro area fixed effects or the time periods covered by the regression. These differences allow us to isolate discrepancies in the source and timing of the correlation between Google search intensity and UI take-up.
Table 1. The relationship between initial UI claims and Google search intensity for unemployment-related terms
| Dependent variable | |||||
|---|---|---|---|---|---|
| log(state claims) | |||||
| log(search) | 0.15* | 0.68** | 0.68*** | 0.90*** | 0.45*** |
| (0.08) | (0.04) | (0.13) | (0.06) | (0.15) | |
| Metro area fixed effects | X | X | X | X | |
| Sample: Great Recession | X | X | |||
| Sample: Current recession | X | X | |||
| Observations | 2,056 | 2,056 | 283 | 231 | 52 |
| Adjusted R2 | 0.08 | 0.71 | 0.56 | 0.83 | 0.19 |
**p < 0.05
***p < 0.01
Notes: This table presents the results from regression analyses examining the correlation between Google search intensity for unemployment-related terms and initial unemployment insurance (UI) claims, controlling for metro area fixed effects and weighted by population. Standard errors, which are in parentheses, are clustered at the metro area level. The regressions of the first two columns use the entire data sample over the period January 2007–May 2020. See the text for further details.
Sources: Authors’ calculations based on data from Google Trends and from the State of California and U.S. Census Bureau from Haver Analytics.
The regression coefficients in the first and second columns in table 1 are estimated from the entire sample of data, which spans from January 2007 through May 2020. They differ only in that the regression specification of the second column includes metro area fixed effects, whereas the regression specification of the first column does not. In other words, through the second column's regression specification, we are trying to answer this question: Are the months when a California metro area’s residents searched more than normal for unemployment-related terms also the months when we saw above-average initial UI claims in that metro area? This type of regression specification is sometimes referred to as a “within” estimator because it examines only the variation over time within each metro area in our sample.
As reported in the second column of table 1, we find an economically and statistically significant relationship between Google search intensity and initial UI claims when including metro area fixed effects (i.e., the p-value associated with the standard error shown in the table is greater than standard levels of significance). This is also true when we do not restrict our attention to just variation within metro areas, but also across them (the cross-sectional dimension), given the regression specification’s result in the first column of table 1. But the magnitude of the relationship is roughly four to five times stronger in the time series dimension. This result matches what we found in our previous post on the correlation between Google Trends search interest in unemployment-related subjects and UI take-up.
The longer time series for California than those of the four states in our previous post (New York, Pennsylvania, Texas, and Washington) allows us to go even further in exploring this relationship. For example, the regression of the third column in table 1 asks the following question: Is this relationship between Google search intensity and UI take-up different during recession months versus expansion months? This is achieved in the regression by restricting the sample to only include the months of the Great Recession and since the start of the current recession.5 We find that the correlation in this case is identical to that of the full sample, such that the answer to our question is a resounding no. This is important because it implies that Google search intensity is related to UI take-up because of factors other than just those associated with a national recession. In other words, differences in local and regional economic conditions unrelated to national conditions are also reflected in our findings.
We can also examine whether this relationship between Google search intensity and UI take-up is different in the current recession versus the Great Recession in the U.S. This is achieved by comparing the regression specifications of the fourth and fifth columns of table 1. Each specification includes the data observed in only one of the two recessions. Using the fourth column’s regression specification, we find that during the Great Recession a roughly 1% increase in search intensity correlates to a 0.9% increase in initial UI claims. In contrast, using the fifth column’s regression specification, we find a correlation that is roughly half of that magnitude. While some differences in the precision of the estimates may be expected based solely on the different number of months included in each sample, the standard errors of our estimates in table 1 indicate that this difference is statistically significant from zero. Therefore, at face value, these results suggest that the relationship between Google search intensity and initial UI claims during the current recession is weaker than it was during the Great Recession. Next, we take a deeper look at the results and show why they are misleading.
Google Trends and Pandemic Unemployment Assistance
What can explain the difference in the correlation between Google search intensity and initial UI claims across the two recessions? We hypothesize that most of the discrepancy is coming from the federal Pandemic Unemployment Assistance program—which permits state governments to extend unemployment benefits to self-employed workers, those seeking part-time employment, and those who would otherwise not be eligible for regular unemployment compensation.6 Established as part of the Coronavirus Aid, Relief, and Economic Security (CARES) Act, the PUA program substantially increased the number of individuals who qualify for unemployment insurance benefits. However, individuals who claim benefits from the federal PUA program are not included in our measures of state initial UI claims in figure 1 and table 1. With many more individuals eligible to file a UI claim now than during the Great Recession, it is highly probable that these individuals, who likely never filed a claim in the past, would be looking for information on how to do so. These searches for more information about unemployment insurance would be related to PUA claims, which are not included in the dependent variable of table 1. Given this factor and the even greater predominance of internet-based search now compared with a decade or so ago, we surmise that at least some of the recent movement in the Google Trends unemployment topic indexes that is not correlated with traditional state initial UI claims is instead connected to the federal PUA program.
Here, though, we reach the limits of what our data for metro areas in California can tell us. PUA claims are not publicly available at the county-level for California, although they are at the state level. In fact, we can look at the PUA data for all states during the current recession to test our hypothesis. Table 2 shows the results from two regressions estimated using a sample of all states (plus the District of Columbia); both include state fixed effects so that we remain focused on variation in the time series dimension. The data have a weekly frequency, and start with the week ending March 14, 2020, and run through the week ending June 27, 2020. For the regression specification of the first column, we only include traditional initial UI claims in our dependent variable; but for the specification of the second column, we add to them the initial PUA claims for each state.
Table 2. The relationship between initial UI claims with and without PUA claims and Google search intensity for unemployment-related terms
| Dependent variable | ||
|---|---|---|
| log(state claims) | log(total claims) | |
| log(search) | 1.00*** | 1.04*** |
| (0.03) | (0.02) | |
| State fixed effects | X | X |
| PUA claims included in dependent variable | X | |
| Observations | 816 | 816 |
| Adjusted R2 | 0.86 | 0.91 |
**p < 0.05
***p < 0.01
Notes: This table presents the results from regression analyses examining the correlation between Google search intensity for unemployment-related terms and initial unemployment insurance (UI) claims, controlling for state fixed effects and weighted by population. Standard errors, which are in parentheses, are clustered at the state level. As indicated, the dependent variable of total claims comprises both state UI claims and federal Pandemic Unemployment Assistance (PUA) claims. The sample period for both regressions is the week ending March 14, 2020, through the week ending June 27, 2020. See the text for further details.
Sources: Authors’ calculations based on data from Google Trends and the U.S. Department of Labor and U.S. Census Bureau from Haver Analytics.
The regression coefficient in table 2 increases in a modest, but statistically significant way when the PUA claims are included in our dependent variable, consistent with our hypothesis that during the current recession at least part of the Google search activity for unemployment-related terms is indeed tied to the introduction of the PUA program. To see what this implies for California, we show in figure 2 the fit of our regressions for just the state of California. This figure makes clear that accounting for PUA claims substantially increases the correlation between Google search intensity and total take-up for both regular state UI and federal PUA in California. Put more concretely, accounting for the PUA claims reduces the mean absolute error (a measure of model fit) by more than 25%—from 0.31 log points to 0.23 log points. Even this result, however, understates the importance of the PUA program, as it includes those weeks in the program’s infancy when state-level claims were not reported.7 These weeks tend to be the weeks with the largest fitting errors. If we use the median absolute error criterion instead to minimize their influence, then accounting for PUA claims improves model fit by more than 50% for California. Overall, we find this to be convincing evidence that once the PUA program is taken into account, the relationship between Google search intensity and UI take-up during the recent recession has remained a strong one.
Figure 2. Fits of the two regressions in table 2 to actual total weekly initial UI claims for California
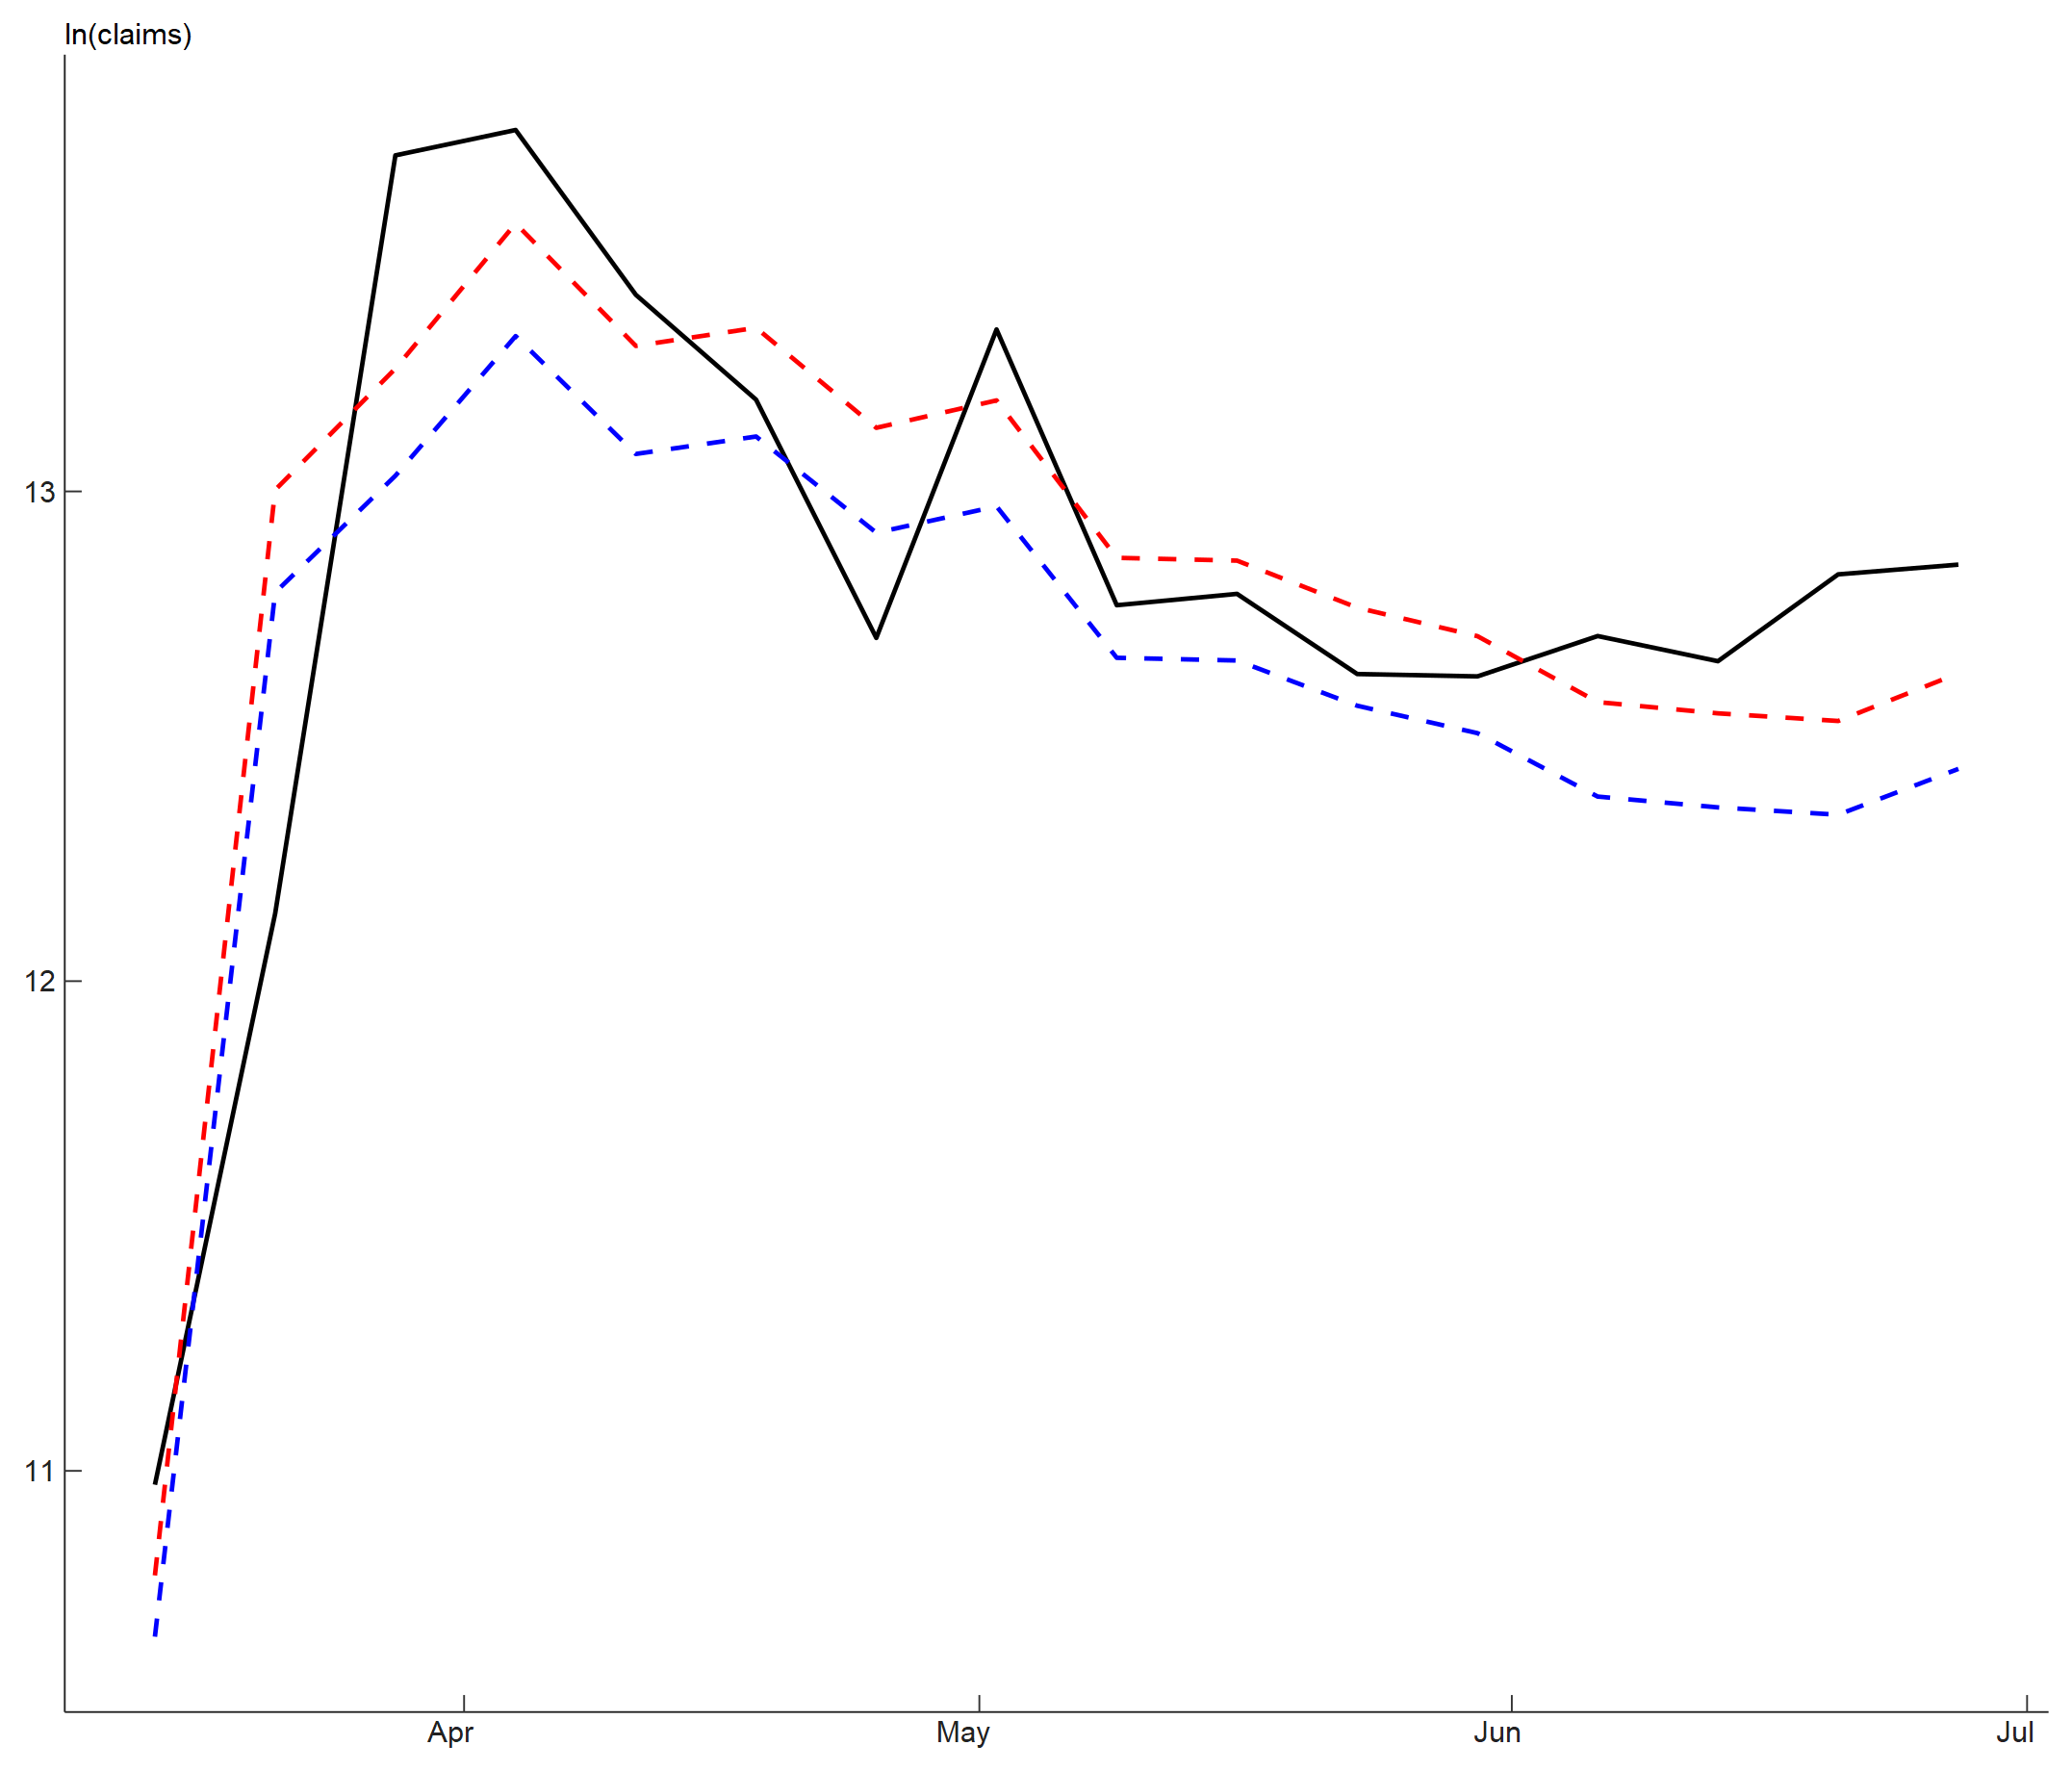
Sources: Authors’ calculations based on data from Google Trends and from the State of California and U.S. Census Bureau from Haver Analytics.
Notes
1 A topic in Google Trends is a categorization or grouping of related search terms.
2 See Gaurav Sood, 2016, “Geographic information on designated media markets,” Harvard Dataverse, data set, version 9.0, Crossref; Sood provides a mapping between counties and the Nielsen DMAs that Google uses to define metro areas. For further details on data construction, see our previous related post.
3 These dates can be found here.
4 Regressions are statistical exercises that estimate the degree of correlation between two variables. In our case, the initial UI claims are the dependent variable (the main factor we are trying to predict) and the Google Trends unemployment topic indexes are the independent variable (the factor we think can be used to predict the dependent variable). Through regression analysis, we come up with a regression coefficient, which represents the mean change in the dependent variable for one unit of change in the independent variable while holding constant the other variables in the analysis that may affect the dependent variable.
5 We include the month of the business cycle peak (December 2007 and February 2020) in the recession samples.
6 Details on this additional relief are available online.
7 These data are also available from Haver Analytics. However, claims data for a few of the weeks in the PUA program’s infancy are not available at the state level. We use the data as reported in each week.


