Federal spending by state
There are many important channels through which the actions of the federal government affect the national economy, with varied effects among the states.1 Among these channels, the direct disbursement of federal funds is sizable, amounting to $3.76 trillion in calendar year 2012. These disbursements include direct federal government programmatic spending for payroll and procurement; payments to individuals and businesses, including Social Security and farm subsidies; and grants to state governments for service programs such as Medicaid, as well as for various education programs.2
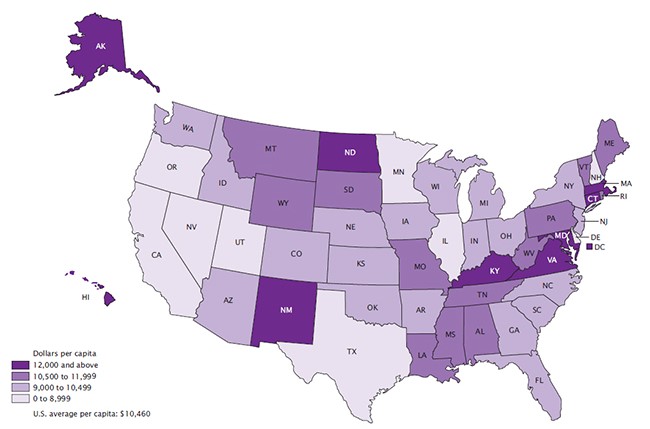
The map below illustrates varied expenditure per capita by states for the last year in which such data were collected under a now-defunct statistical data program.3 To a rough degree, this expenditure pattern reflects the geographic impact—the initial impact, that is—of any hypothetical across-the-board cuts or hikes in federal budgetary spending.4 However, we should not take this pattern at face value. The allocation of federal funds to a given state may be misleading if the receiving authority “passes through” the allocation in spending to a subcontractor that is located in another state. And even if the funds are not passed through, the ultimate economic impacts of federal spending on households and firms in a state are likely to differ significantly following subsequent rounds of spending by firms and households. State economies are highly intertwined through diverse channels of trade, investment, and cross-state spending.
Figure 1. Federal government spending, per capita ranges by state (fiscal year 2010)
With these caveats in mind, let’s look at recent budgetary cuts. Beginning in January 2013, a series of changes were enacted to future taxes and spending during the government budgetary crisis period that became known as the “fiscal cliff”. The lion’s share of these actions entailed tax increases for 2013 that will amount to almost $400 billion.5 In addition, largely under provisions of the Budget Control Act of 2011 (BCA), mandatory cuts in federal spending authorization are also taking place. For fiscal year 2013, these cuts amount to almost $109 billion dollars.6
For several reasons, the state-by-state geographic pattern of sequestration cuts differs from the aforementioned pattern of federal spending (figure 1). For one, major portions of the federal budget such as Social Security and and Medicaid are excluded under the BCA. Similarly, the BCA requires that overall cuts are allocated equally between defense and non-defense categories of programs. Since the underlying defense/non defense split differs from state to state, we would expect the cuts to differ as well.
For much of the remainder of federal spending, however, the cuts are scheduled to take place proportionately across individual programs. This allows us to estimate the overall spending reduction that is taking place in each state. In doing so, one of our key assumptions is that program managers choose to cut program spending proportionately in each state. That is, we apply the relevant sequestration percentage to a given budget account and assume that the account’s manager allocates the same percentage cut across all states. For example, we assume the mandated 5% to federal housing vouchers is achieved by cutting each state’s existing housing vouchers funding by 5%.7 To arrive at each state’s overall cut in spending, we sum across the program cuts for each state.
Table 1 shows the ten states facing the largest percentage cut from sequestration for 2013. Unsurprisingly, the District of Columbia, Virginia, and Maryland rank at the top of the list due to their proximity to the nation’s capital and relatively larger share of government-related economic activity.
Table 1
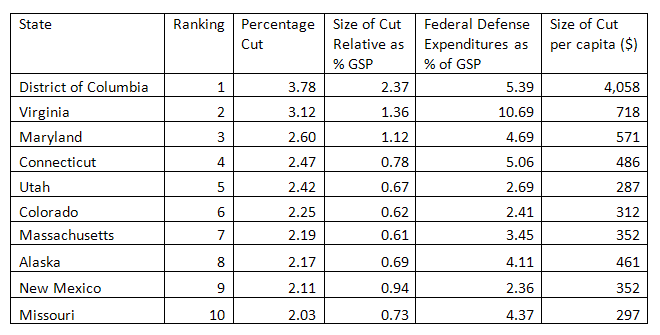
For the remaining states, the level of defense procurement and civilian defense employees there largely determine the size of the overall sequestration cuts.8 These cuts are further scaled in relation to each state’s economy as measured by gross state product (column 4). We also calculate the size of funding cuts per capita (column 6).
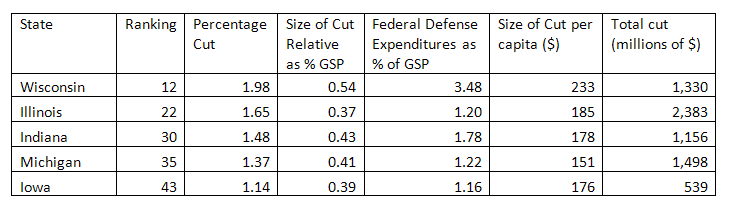
Table 2 focuses on the five states in the Seventh District. Wisconsin ranks relatively highly due to its exposure to defense cuts. Despite low defense exposure, Illinois ranks near the middle of the list due to above-average levels of Medicare expenses and federal unemployment compensation. Cuts to funding available for various federal mortgage insurance programs also affect Illinois, though the actual economic effect of such cuts will depend on when and if claims are filed.
Table 2
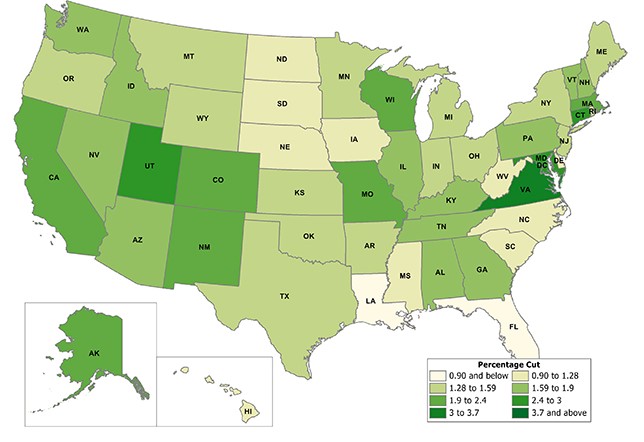
The Congressional Budget Office has estimated that sequestration will reduce real GDP growth by 0.6 percentage points during this calendar year.9 Our analysis illustrates that sequestration-mandated cuts will vary widely by region. Although the size of cuts varies largely according to the states’ exposure to the defense sector, other state-specific factors are important as well. States that receive above-average funding for programs like Medicare, federal mortgage insurance, unemployment compensation, Section 8 housing vouchers, research grants, or Head Start early education programs can expect to experience larger programmatic cuts overall.
The graphic below illustrates our findings for the 50 states.
Figure 2. Estimated sequester exposure
Footnotes
1 Among these channels are regulatory policy, tax structure, macro-economic policy, and spending programs.
2 Subsidized federal insurance programs as well as other guarantees also play an important role.
4 Not all federal spending is allocated, the biggest item being interest on federal debt. A discussion of coverage is available online, pp. xv, xvi.
5 Tax increases for 2013 and beyond included a rise in the Social Security payroll tax, a new Medicare surtax on high-income households, higher rates on income from capital gains, and higher tax rates on individual income (especially in higher income tax brackets).
6 The fiscal year of the federal government begins on October 1. On March 1, 2013, spending cuts of approximately $85 billion took place equally to nonexempt defense and non-defense programs. Under current law, an additional $109 billion in cuts are required for each fiscal year from 2014 to 2021. Given a lag in timing between appropriations and actual expenditures, actual spending cuts are estimated to amount to somewhat less. Additional deficit reduction for the year derives from the expiration of federal unemployment benefits ($34 billion) and the expiration of scheduled hikes in reimbursement fees to physicians under Medicare ($10 billion).
7 Data on federal transfers to states come from the U.S. Census Bureau’s 2010 Consolidated Federal Funds Report (CFFR). These are the latest available data. Detailed county-level data from the Census Bureau are available online. To arrive at estimated spending cuts, spending from CFFR categories by state are matched to the relevant programmatic percentage cuts as determined by OMB. Programs related specifically to the American Recovery and Reinvestment Act (ARRA) are omitted since the majority of these funds are assumed to have been spent before March 2013. Specific exceptions to cuts are checked against analysis prepared by the Congressional Research Service. In the interest of tractability, the bottom 5% of total spending is omitted from our geographic allocation since these are distributed across a very large number of small accounts.
8 President Obama has exercised his authority to exempt active-duty military personnel.


