

Early last month, we unveiled a new real-time model called CHURN—short for Chicago Fed Unemployment Rate Nowcast. CHURN is designed to provide a weekly tracking estimate for the U.S. civilian unemployment rate by blending monthly statistics on job flows from the U.S. Bureau of Labor Statistics’ (BLS) Current Population Survey (CPS) with both traditional and alternative high-frequency labor market indicators from government and private sector sources.
In this Chicago Fed Insights article, we update our CHURN weekly tracking estimates for the civilian unemployment rate to include the period of May 18–June 14, 2025. As such, our update here covers the period between the May and June reference weeks1 used by the BLS in the CPS—with our latest CHURN tracking estimate representing the nowcast for the June unemployment rate, which will be released in the next Employment Situation report on July 3, 2025.
At 4.26%, the CHURN nowcast for June suggests little change in the rate from its unrounded value in May. However, from a broader probabilistic standpoint, the uncertainty inherent in our CHURN estimates implies roughly 50/50 odds of (at least) a 0.1 percentage point increase in the civilian unemployment rate from its rounded value (as it is customarily reported by the BLS) of 4.2% in May.
Recent developments in job flows according to CHURN
As our Chicago Fed Letter explains in more detail, CHURN is based on what is often referred to as the bathtub model of unemployment, focusing on the flows into (job separations) and out of (job finding) unemployment. Together, the job-separation and job-finding rates define a flow-consistent unemployment rate (FCR) capturing the net effect of these job flows over time.2 FCRs are widely known to be accurate predictors of official unemployment statistics. With CHURN, high-frequency measures of job flows that correlate highly with the job-separation and job-finding rates derived from the CPS are used jointly to construct a model-implied job-separation rate, job-finding rate, and FCR from which an unemployment rate nowcast for the latest BLS reference week is then formed.
Figure 1 shows the CHURN model-implied job-separation rate, job-finding rate, and FCR values for each BLS reference week since January 2025 alongside the official civilian unemployment rates observed for the same periods. The CHURN values are predicted from a two-factor partial least squares (PLS) model estimated on CPS-derived measures of the job-separation and job-finding rates along with ten other traditional and alternative labor market indicators.3
1. CHURN model-implied estimates and the U.S. civilian unemployment rate, 2025
| Jun | May | Apr | Mar | Feb | Jan | |
| CHURN model-implied estimates (percent) | ||||||
| Job-separation rate | 2.08 | 2.07 | 2.04 | 2.05 | 2.03 | 2.04 |
| Job-finding rate | 46.37 | 46.68 | 47.72 | 48.17 | 47.78 | 47.78 |
| Flow-consistent unemployment rate |
4.30 | 4.25 | 4.10 | 4.07 | 4.07 | 4.03 |
| Civilian unemployment rate (percent) | 4.26 | 4.24 | 4.19 | 4.15 | 4.14 | 4.01 |
Sources: Authors’ calculations based on data from Bloomberg (via Investing.com), Google, Indeed, Morning Consult, and Haver Analytics.
As the June values demonstrate, CHURN sees a small uptick in the model-implied job-separation rate since the May reference week and a modest decline in the model-implied job-finding rate. On net, this produces a June model-implied FCR of 4.30%, five basis points higher than the estimated May value. This change in the model-implied FCR translates to a two basis point increase, from 4.24% to 4.26%, in the (unrounded) civilian unemployment rate from May to June.
CHURN tracking between reference weeks
Figure 1 focuses on only the BLS reference week of each month. CHURN, however, also provides a tracking estimate for every week in between those weeks. Figure 2 shows the progression of CHURN weekly values during the May tracking period4 (blue markers) compared with actual values of the civilian unemployment rate (black markers) and the Bloomberg consensus forecast5 for the May unemployment rate (red marker).
2. May 2025 CHURN tracking period
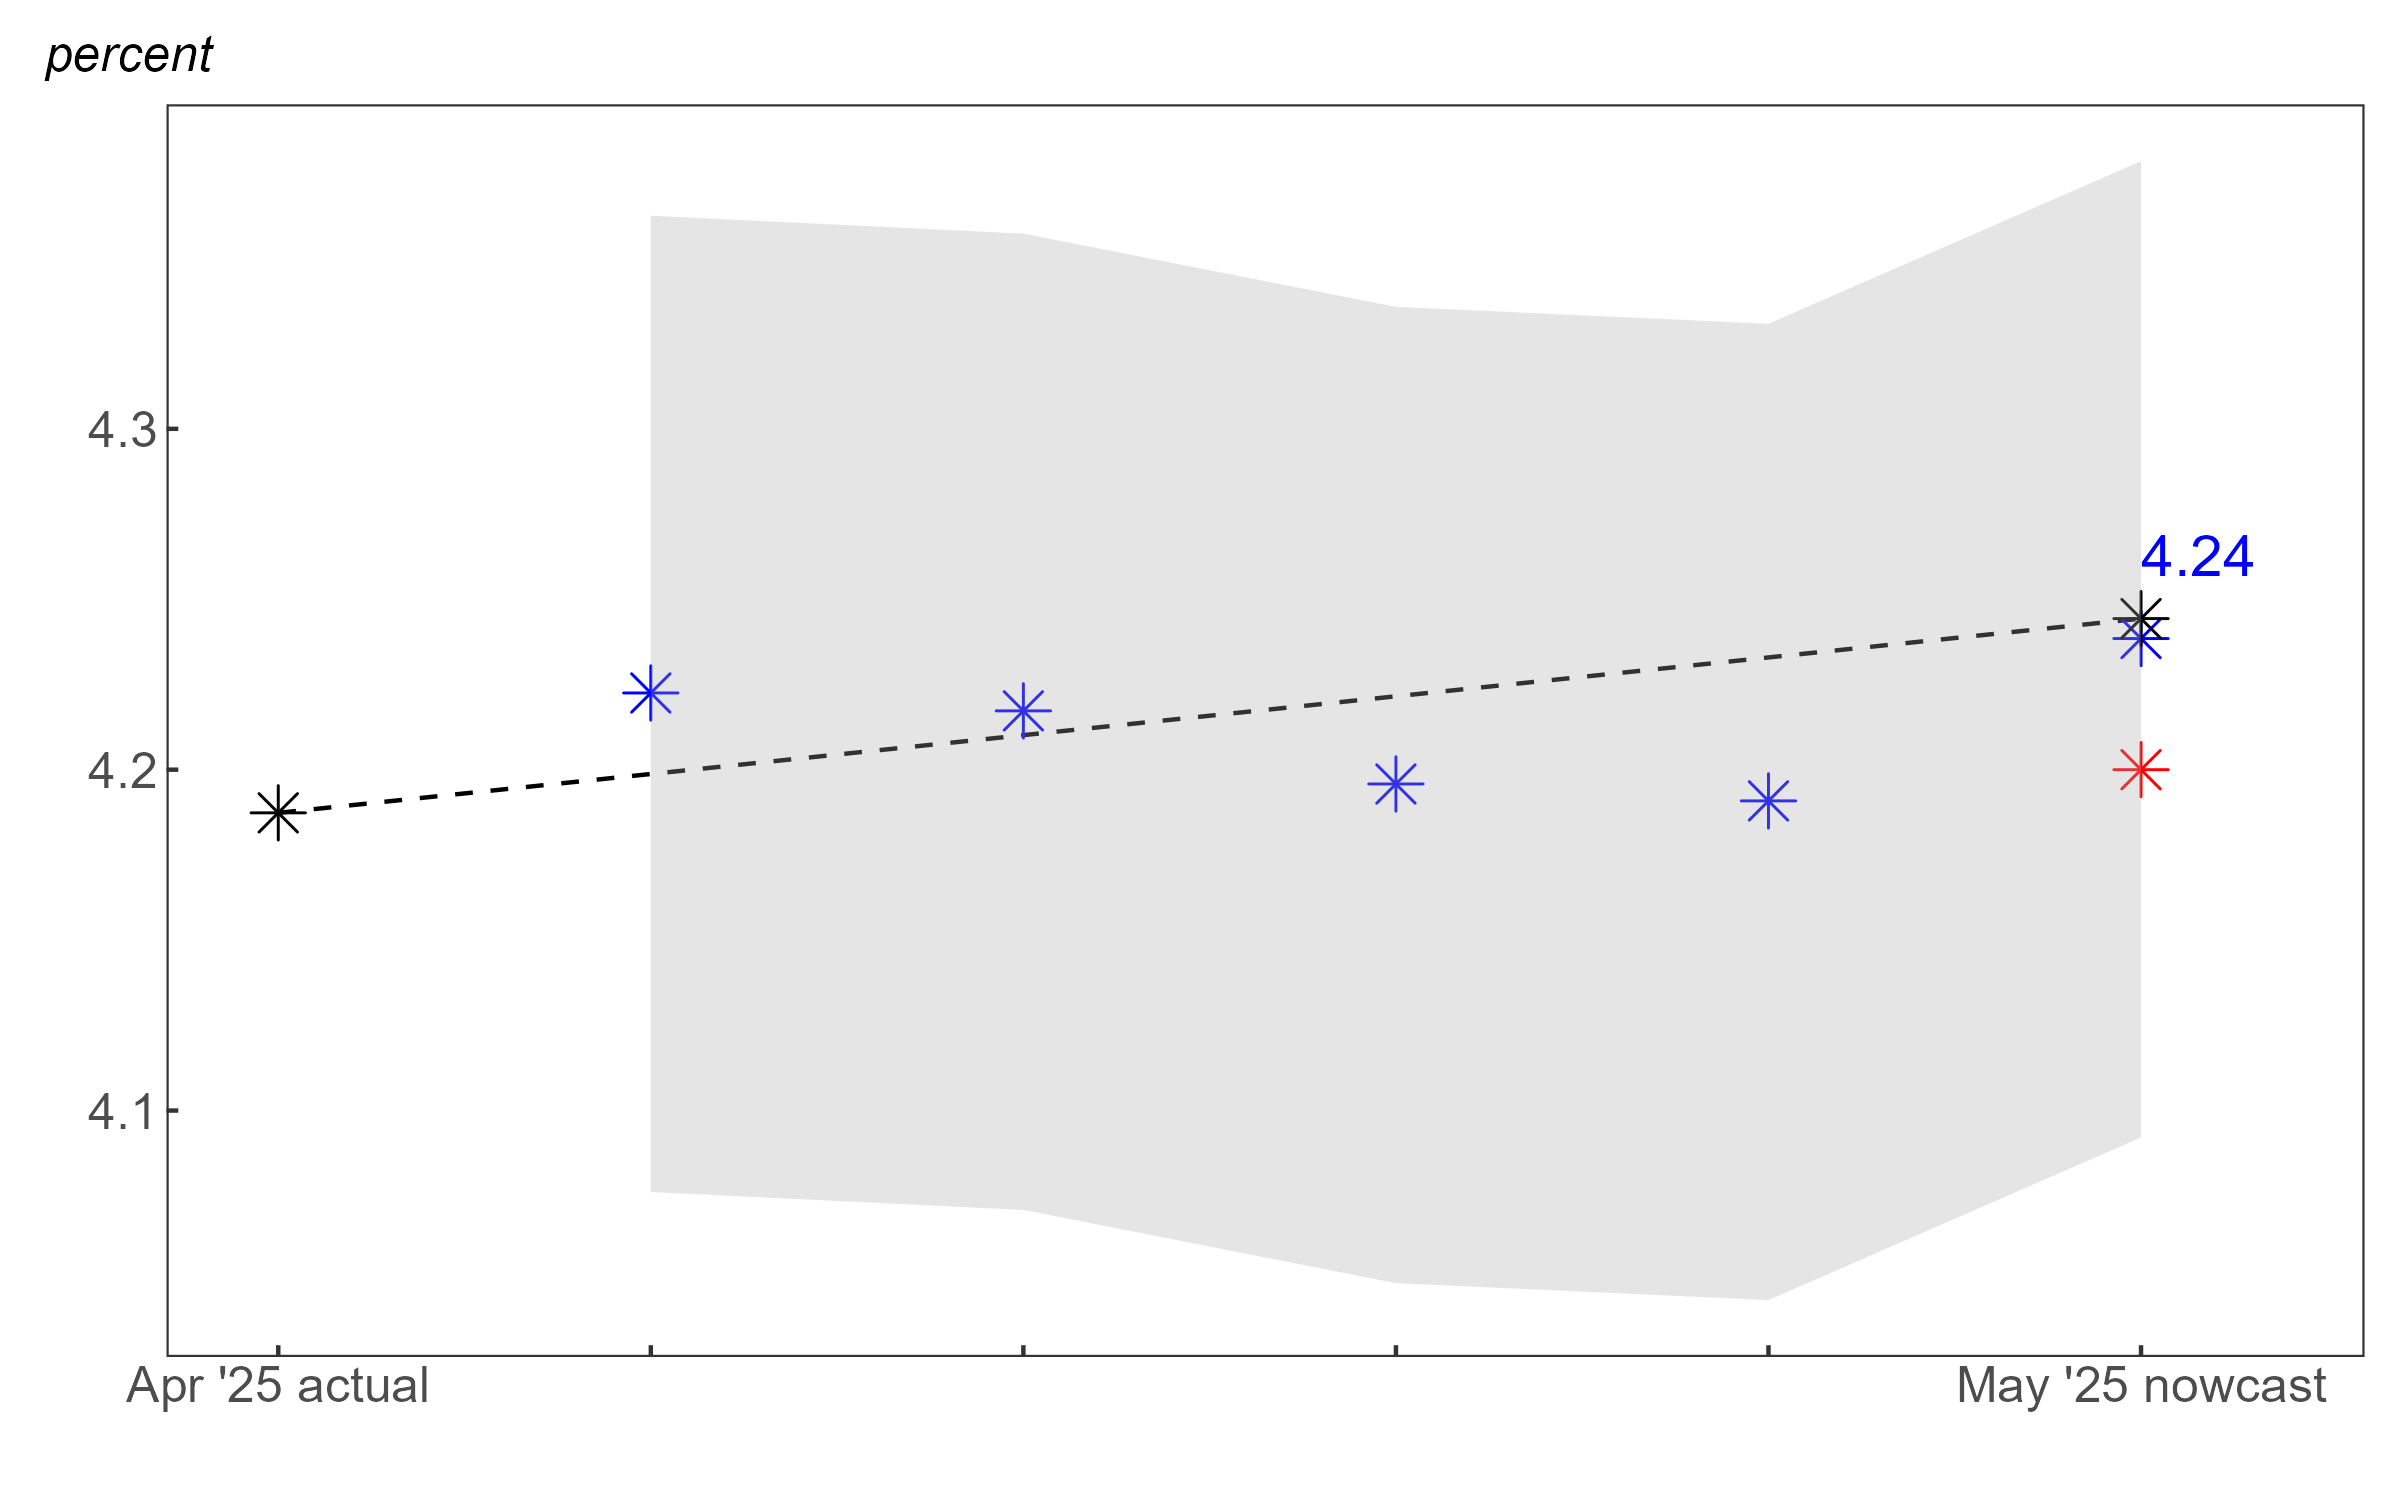
Sources: Authors’ calculations based on data from Bloomberg (via Investing.com), Google, Indeed, Morning Consult, and Haver Analytics.
In our June 5 CHURN release, published alongside the Chicago Fed Letter introducing CHURN, we reported a May reference week nowcast of 4.24%—which proved to be right in line with the actual unemployment rate published the following day. The Bloomberg consensus forecast, which is only reported to one decimal place, also accurately reflected the rounded May value of the unemployment rate at 4.2%. However, with the weekly tracking provided by CHURN, we can see that the May reference week likely represented a high point for the unemployment rate over the six-week period shown in figure 2.
Figure 3 shows the progression of CHURN values during the June tracking period, ending with the June reference week estimate of 4.26%. CHURN values since the May reference week (i.e., the week ending May 17) have oscillated within a total range of about 4 basis points above and below that reference week’s value over the period, peaking at a little over 4.26% in week 2 after the May reference week and falling as low as 4.22% in week 1 after the May reference week.
3. June 2025 CHURN tracking period
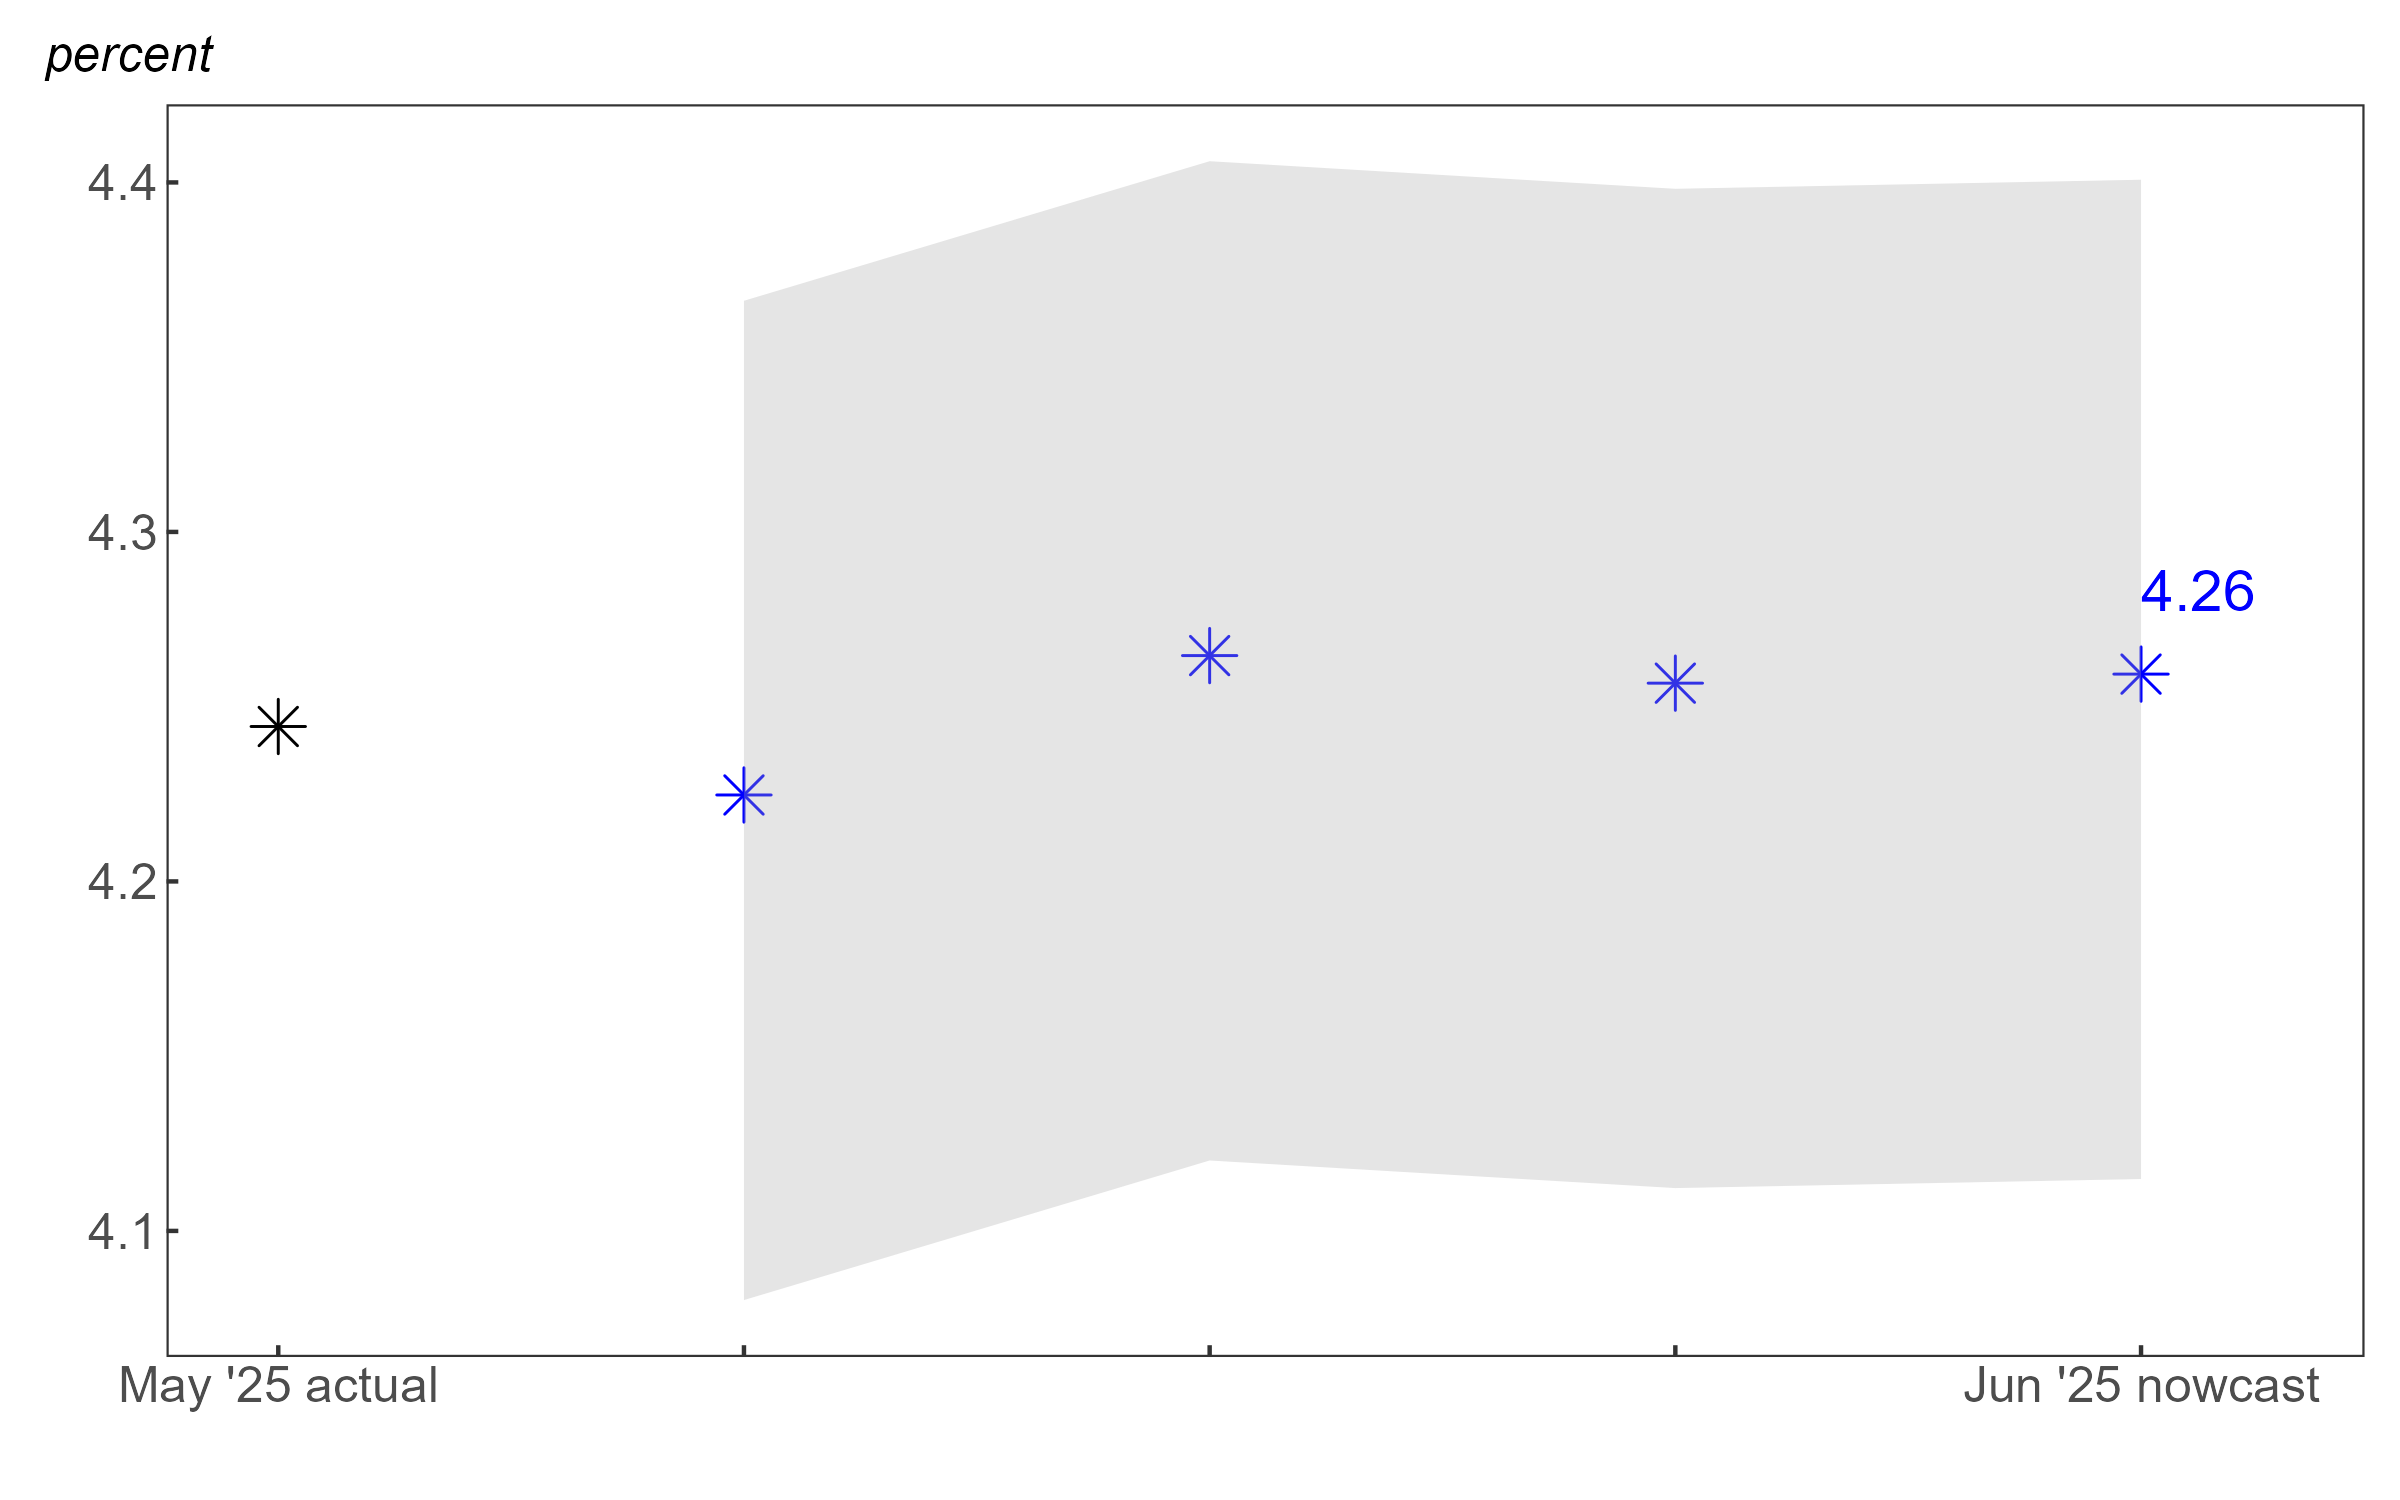
Sources: Authors’ calculations based on data from Bloomberg (via Investing.com), Google, Indeed, Morning Consult, and Haver Analytics.
The gray ribbon surrounding the tracking estimates in both figures 2 and 3 represents a 68% prediction interval summarizing the uncertainty inherent in each CHURN weekly estimate. It shows where we would expect, based on the historical performance of the CHURN model, the actual unemployment rate value to fall roughly 68% of the time. We can use the intervals to make a probabilistic judgment of the likely direction of change in the unemployment rate.
The CHURN nowcast of 4.26% for the June reference week implies roughly 50/50 odds that the actual unemployment rate comes in at a rounded value of 4.3% or higher. The most recent CHURN estimates, as of July 2, 2025, are available online.
Notes
1 The BLS reference week for the CPS is typically the week containing the 12th day of each month.
2 The FCR is the ratio of the job-separation rate to the sum of the job-separation and job-finding rates. With constant job-separation and job-finding rates, the unemployment rate will converge to the FCR over time.
3 Further details on the PLS model, the various labor market indicators in CHURN, and the method used to convert the change in the model-implied FCR to a change in the civilian unemployment rate can be found in Chicago Fed Letter No. 506.
4 The May 2025 tracking period begins with the first week following the April reference week and ends with the May reference week. Therefore, when we refer to a specific month’s tracking period, we mean that month’s reference week plus the preceding weeks back to the previous month’s reference week.
5 This is the consensus forecast for the yet-to-be-released unemployment rate as shown on Bloomberg’s economic calendar (sourced from Investing.com).


