

The following publication has been lightly reedited for spelling, grammar, and style to provide better searchability and an improved reading experience. No substantive changes impacting the data, analysis, or conclusions have been made. A PDF of the originally published version is available here.
The Canada-U.S. Free Trade Agreement (FTA) of 1989, recast in 1994 to include Mexico, predictably strengthened the Great Lakes region’s binational integration. The region, comprising Ontario in Canada and Ohio, Michigan, Indiana, Illinois, Wisconsin, and Minnesota in the U.S., has long rivaled any binational region in the world in size, economic importance, and the degree of its integration. This Chicago Fed Letter reviews the region’s features and progress toward integration as a path to success in the emerging global economy.
Population and workforce
Ontario comprises close to two-fifths of Canada’s population. On the U.S. side, the six states of Ohio, Michigan, Indiana, Illinois, Wisconsin, and Minnesota, comprise 18% of the much larger U.S. The Great Lakes states’ share of national population declined from 21.5% to 18% from 1971 to 1999. Over the same period, Ontario’s share of Canada’s population edged up slightly from 37.4% to 37.8%.
Immigration between Canada and the U.S. is the exception rather than the rule. Canadian and U.S. citizens do travel frequently between the countries for work and leisure, but they generally prefer to maintain their citizenship. Instead, both countries have drawn significant streams of immigrants from other countries. In 1996–97, Ontario attracted 52.9% of Canada’s immigration. In the Great Lakes states, immigration has helped to offset net domestic out-migration to the southern and western U.S. However, the net flow of immigrants to other U.S. regions outpaces that to the Midwest.
One concern about immigration in the U.S. centers on fiscal losses arising from the potential deficit in taxes paid by immigrants, net of the benefits they draw from government programs. Such losses may arise owing to the skill deficiencies of many recent immigrants to the U.S. A rising trend of immigrants from Central and South America accounts for a pronounced erosion in skill levels of successive groups of immigrants. This trend also raises concerns over downward wage pressures on low-skilled U.S. workers and perhaps adds to widening income disparities among households.1 However, new immigrants also create new patterns of spending and new income, which may not skew the existing pattern of wages at all.
In contrast, recent immigration to Canada is often seen in a favorable light. Highly skilled Asian immigrants have provided a stopgap to the alleged “brain drain” of technical workers from Canada to the U.S.2 In part, the alleged brain drain derives from a roaring U.S. economy that is short of labor, especially in high-tech sectors. Also, the economic recoveries of Canada and Ontario have been unfolding later than those of the U.S. and the Great Lakes states in the 1990s, leaving a larger pool of untapped labor in Canada.
As a result of differing degrees of labor market tightness across the region’s borders, one might expect to observe greater flows of workers from Ontario to the Great Lakes states and other U.S. regions. Immigration and cross-border work and travel barriers are breaking down while, at the same time, there is a potential imbalance between the demand for skilled workers in developed parts of the world—Japan, western Europe, the U.S., and Canada—and developing countries in eastern Europe and Asia, where population and educational levels continue to climb. Of course, given the recent tendency of trade flows to favor services rather than goods (such as software development), the need for immigration and personal business travel may actually wane rather than rise. Comparative advantages in producing such high-tech services may shift to locales with an abundance of skilled labor.
Regardless of these forces, the U.S. and Canada have tried to make business travel easier. NAFTA (North American Free Trade Agreement) facilitates cross-border work for three categories of workers: 1) professionals, 2) intra-company transfers, and 3) traders and investors. More than 26,000 Canadians obtained NAFTA visas in 1996, compared with 2,600 similar arrangements ten years earlier.3 Cross-border trips by Canadians and U.S. citizens run from 80 million to 90 million per year (for all purposes). Overnight person-trips increased by 29.1% from 1979 to 1995; day trips have increased by 40%.
Manufacturing bulwark
Ontario and the Great Lakes states represent the manufacturing core of their respective countries (see figure 1). Ontario accounts for about 55% of Canada’s manufacturing output, while the Great Lakes states account for about 25% of U.S. manufacturing. Although their share of manufacturing output has declined over the past 30 years, these states comfortably remain the manufacturing center of the U.S. Meanwhile, Ontario has maintained its share of Canada’s manufacturing output.
1. Index of manufacturing intensity
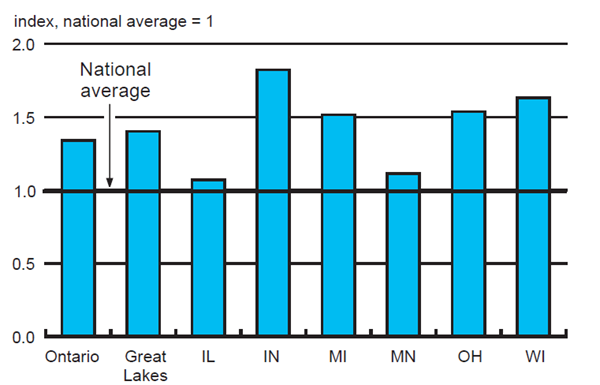
Industry sectors in Ontario tend to be more labor and resource intensive; whereas, in the Great Lakes states they tend to be more capital and technology intensive.4 For instance, an index of employment concentration for nonelectrical machinery (an important capital-intensive industry) scores 0.60 for Ontario (only 0.47 for all of Canada) but 1.88 for the Great Lakes states in 1996.5 Ontario’s apparent deficit of capital goods production in an otherwise manufacturing powerhouse tends to be filled by exports from the Great Lakes states. Imports of machinery to Ontario from the U.S. side of the Great Lakes exceeded exports by CN $6.3 billion in 1998.
One common industry sector looms large, however. The Great Lakes region—Ontario included—dominates North American assembly of motor vehicles, though the Great Lakes states’ share of U.S. assembly declined from 66.7% in 1986 to 56.4% in 1997. This decline is primarily due to the drop in Michigan’s share of light vehicle assembly from 40.7% to 25.4% in 1997. (One notable offset is Indiana’s gain in share from 4.8% to 9.5% over the decade.6) This trend follows a shift of the auto belt southward toward Kentucky and Tennessee, which has been led by the Japanese automakers, with lesser participation by U.S. companies.7 However at the same time, auto production has centralized from the east and west of the U.S., along the I-65/I-75 auto corridor in the Midwest. Meanwhile, Ontario continues to assemble more than four-fifths of the vehicles produced in Canada.8 All in all, the auto sector has long been the region’s most integrated industry, dominating its export and import traffic.
Trade and investment linkages
Strong trade and investment linkages among the Great Lakes states and between the states and Ontario have long been an archetype for cross-border integration. More recently, this highly integrated binational economy has served as a building block toward growing trade with the rest of the world.
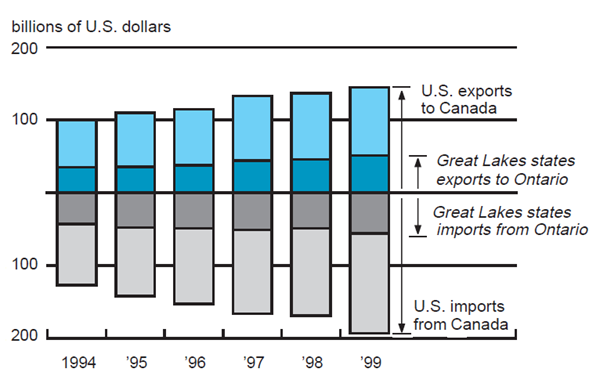
Canada is both the U.S.’s and the Great Lakes states’ largest trading partner. The total volume of exports and imports within the Great Lakes region amounted to over U.S. $100 billion in 1999.9 Great Lakes states’ exports to Ontario in 1999 accounted for 88.6% of the states’ exports to all of Canada and around 35% of the U.S.’s total exports to Canada.
This tight relationship is encouraged by physical proximity and has been strengthened by various efforts at liberalizing the cross-border flow of goods and services. The signing of the Auto Pact in 1965 established freer trade between Canada and the U.S. in autos. The Canada-U.S. FTA in 1989 provided for the elimination of tariffs in most other products and services. And more recently, NAFTA brought Mexico into the FTA’s free trade zone. As we would expect, U.S.-Canada trade has grown in the aftermath of these agreements.
U.S. exports to Canada were 44% higher in 1999 than in 1994 (figure 2). Likewise, exports from the Great Lakes states to Canada have grown by 36.8% since 1994 when NAFTA went into effect. While these figures are substantial, other export destinations are growing at a faster rate than Canada–namely, Mexico and Central and South America. While the Great Lakes states’ exports to Canada grew at an average annual rate of 9.2% over 1989 to 1998, these markets posted growth rates of 21.4% and 18.9%, respectively. Exports to Mexico and Central and South America from the Great Lakes states and Ontario combined grew at an average annual rate of 16.9% and 11.4%, respectively, from 1995 to 1998.
2. Canada/U.S. and Great Lakes trade
Because the majority of the region’s trade is comprised of heavy manufacturing and natural resources, vast north–south rail and road networks have developed to accommodate it. Transportation avenues have historically been at the heart of the binational relationship. The Great Lakes-St. Lawrence River system formed a natural trade and transportation route. Recent examples of efforts to create a “seamless” transportation system include the merger of Canadian National and Illinois Central and the one proposed by Canadian National and Burlington Northern Santa-Fe, which would create a rail network to link Canada, the U.S., and Mexico. Improvements in highway infrastructure and telecommunications technology (such as global positioning systems), as well as manufacturing’s needs of flexible and timely delivery, have also made trucking a favored form of transport across the border.
Trade linkages of the binational Great Lakes region have also been reinforced of late by foreign direct investment (FDI) flows. In 1987, U.S. direct investment in Canada represented 70% of total inward FDI flows, and the U.S. was the destination for 66% of Canadian direct investment flows abroad. One potential incentive to invest in a foreign country is to avoid trade barriers. Consequently, one might expect to see a decline in investment between the U.S. and Canada after the FTA in 1989. To the contrary, FDI and trade flows do not appear to be acting as substitutes, but rather as complements. The stock of Canadian investment in the U.S. increased by 82% from 1994 to 1998. There is some evidence, however, of a diversion of investment to other countries. While FDI levels have grown, the U.S. share of Canadian direct investment abroad declined from 66% in 1987 to 52% in 1997. And while the U.S. remains the largest host country of Canadian FDI, the U.K. and other countries are increasing in importance.
The trend is similar in outward flows from the U.S. U.S. direct investment capital flows to Canada in 1999 were more than double the amount in 1994. Canada’s share of the stock of U.S. FDI, however, has undergone a long-term decline in the past 20 years, owing to the soaring growth of U.S. investment in emerging markets and Europe. In 1978, Canada represented 22% of the stock of U.S. direct investment abroad; in 1998 this figure had fallen to 11%.10 More broadly, Canada’s importance as a host country for worldwide FDI has declined significantly over the last decade. Its share of the world inward FDI stock dropped from 9% in 1985 to approximately 4% in 1996, while both the U.S.’s and Mexico’s shares of global FDI inflows have increased.11 This falloff became one of the arguments in favor of Canada’s entry into the FTA and NAFTA, in the hope that it would stimulate inward FDI, i.e., as a means for firms from around the world to secure access to the world’s largest market.
The close U.S.–Canada investment relationship is evident at the Great Lakes regional level as well. Within the U.S. Great Lakes region, employment by Canadian affiliates increased from 106,000 people in 1987 to 115,000 in 1997. Even so, FDI in the Great Lakes states by non-Canadian companies has been larger, so Canadian affiliates’ share of Great Lakes states’ employment by non-U.S. companies declined from 17.6% in 1987 to 12.4% in 1997. The main force behind this appears to be Japan’s surging FDI. Since the 1980s, many Japanese auto manufacturers have set up operations in the U.S. and the auto-intensive Great Lakes states. Japanese investment in the automotive parts industry has unfolded in Ontario as well, and since 1980, 16 of the 20 Japanese-owned auto supplier plants in Canada have opened in Ontario, adding over 5,000 jobs.
Multinational corporations are typically the conduits for both investment and trade flows. In a recent survey of over 1,900 Midwest firms, respondents indicated that the top three countries where they are likely to expand in the next five years are Mexico, China, and Canada.12 Thus, while the Great Lakes region will continue to increase its links with the rest of the world, the binational relationship is likely to remain strong.
Conclusion
The binational Great Lakes economy stands as a prototype of what economic regions will increasingly look like in the “global economy.” The region has a long history of highly integrated markets, linkages between its industries, and cooperation among its people. Lower barriers to trade and investment have recently intensified trade between the U.S. and Canada (and Mexico), but the Great Lakes economy had already achieved these linkages years before, so that the boosts to Ontario-Midwest interregional trade and investment have been less impressive than elsewhere. Even so, trade and investment among Great Lakes companies expanded rapidly during the 1990s. At the same time, the region is showing signs of evolving into a more integrated global economy, beyond its historical binational character. For this binational region, closer integration has become a successful path to full globalization.
Tracking Midwest manufacturing activity
Manufacturing output indexes (1992=100)
| February | Month ago | Year ago | |
|---|---|---|---|
| CFMMI | 137.6 | 137.2 | 130.4 |
| IP | 147.5 | 147.0 | 139.3 |
Motor vehicle production (millions, seasonally adj. annual rate)
| March | Month ago | Year ago | |
|---|---|---|---|
| Cars | 5.6 | 5.6 | 5.6 |
| Light trucks | 7.0 | 6.9 | 6.7 |
Purchasing managers' surveys: net % reporting production growth
| March | Month ago | Year ago | |
|---|---|---|---|
| MW | 61.8 | 59.6 | 59.6 |
| U.S. | 61.8 | 61.3 | 58.0 |
Manufacturing output indexes, 1992=100
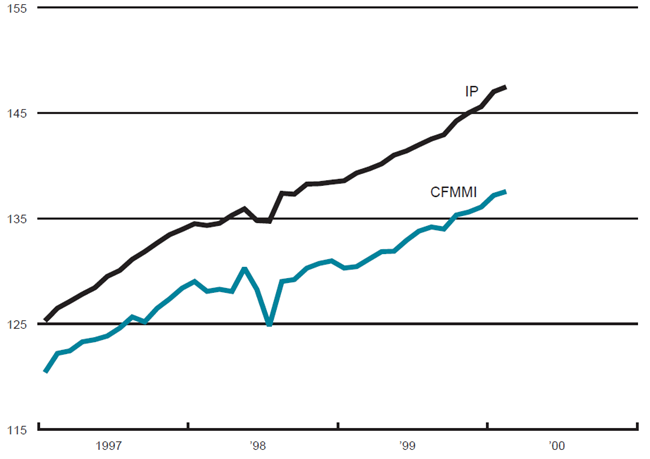
The Chicago Fed Midwest Manufacturing Index (CFMMI) rose 0.3% from January to February, reaching a seasonally adjusted level of 137.6. Revised data show the index had risen 0.8% from December to January. In comparison, the Federal Reserve Board’s Industrial Production Index (IP) for manufacturing also increased 0.3% in February, after rising 1% in January.
Light truck production increased slightly from 6.9 million units in February to 7 million units in March, and car production remained constant at 5.6 million units in both February and March. The Midwest purchasing managers’ composite index for production increased to 61.8% in March from 59.6% in February. The index increased in Chicago, Detroit, and Milwaukee. The national purchasing managers’ survey for production increased from 61.3% to 61.8% from February to March.
Notes
1 George J. Borjas, 1998, “The labor market impact of immigration,” paper presented at Workforce 2020 Conference, Hudson Institute, Indianapolis, September 24.
2 The Gazette, 1997, “Brain gain issue,” Montreal, November 8, cites research suggesting the brain drain to the U.S. is significant, but the offsetting gain from the rest of world is much greater. For a contrary view, see Don DeVoretz and Samuel A. Laryea, 1998, “Canadian human capital transfers: The U.S.A. and beyond,” Simon Fraser University, mimeo, June 7.
3 Rosanna Tamburri, 1998, “Canada frets high-tech ‘brain drain’,” Wall Street Journal, May 12.
4 David R. Allardice and Steve Thorp, 1995, “A changing Great Lakes economy: Economic and environmental linkages,” U.S. Environmental Protection Agency, SOLEC, Chicago, working paper, No. EPA 905-R-95-017, August.
5 Ratio of industry’s share of total employment in the geographic area to its share of total employment in Canada and the U.S.
6 Calculations using gross state product data from the U.S. Bureau of Economic Analysis (BEA).
7 Thomas H. Klier, 1999, “Agglomeration in the U.S. auto supplier industry,” Economic Perspectives, Federal Reserve Bank of Chicago, First Quarter, pp. 18–34.
8 Allardice and Thorp, op. cit.
9 David R. Allardice and William A. Testa, 1991, “Binational economic linkages within the Great Lakes region,” in The Great Lakes Economy Looking North and South, William A. Testa (ed.), Federal Reserve Bank of Chicago, pp. 1–20.
10 Calculations are based on data from the BEA on a historical cost basis.
11 Industry Canada, 1998, “Canada’s relative investment performance,” in Micro-Economic Policy Analysis Branch Bulletin, Vol. 4, Special Issue, Spring, p. 8.
12 Financial Times and Arthur Andersen, “International business survey, Midwest results,” 1999.


