

Introduction and summary
We document the sharp increase in trading activity, gross and net notional outstanding, and overall premiums in the U.S. sovereign credit default swaps (CDS) market that took place during the 2023 debt ceiling episode. Unlike the periods leading up to the 2011 and 2013 debt ceiling events, we show that in the recent episode elevated CDS spreads were partially due to a high expected loss given default, because of the very low valuations of long-term Treasury securities that would have been deliverable to settle CDS contracts. We infer the likelihood of a U.S. default from these CDS premiums and estimate an increase in the market-implied default probability from about 0.3–0.4% in 2022 to about 4% in April 2023, which is lower than it was in July 2011 and about where it was in October 2013. Finally, we document changes in Treasury bills trading activity as market participants updated their expectations for a U.S. default.1
The U.S. “debt limit” is the total amount of money the U.S. government can borrow to meet its existing obligations. On January 19, 2023, the U.S. reached this limit and the Treasury took “extraordinary measures” in order to prevent a default while Congress was deliberating a debt-limit increase. While past debt-limit episodes resulted in congressional actions to raise the limit, these events have implications for market pricing of a potential default by the U.S. on its debt.2 Indeed, CDS premiums referencing U.S. government debt increased significantly in the first half of 2023. In this article, we use U.S. sovereign CDS data to examine the market-implied default probability of a U.S. default event. We refer to such a measure as a “risk-adjusted” probability, because it incorporates an adjustment due to market participants’ attitude toward default risk, the uncertainty surrounding the loss given a default, and more broadly, the scale of a default. Moreover, we compare the 2023 estimates to those computed for the two previous major debt ceiling episodes of 2011 and 2013.
The market for U.S. sovereign credit default swaps: A brief history and recent developments
A credit default swap is a financial contract that allows two parties to trade credit risk, or the risk that a borrower (or reference entity) will default on its bonds or loans. This occurs when one of the parties, known as the “protection buyer,” pays a premium to a “protection seller.” In exchange for the premium payments, if the borrower reference entity defaults on its bonds or loans, the protection seller is required to make a payment to the protection buyer based on the decrease in the market value of the borrower’s bonds and loans (e.g., Cocco, 2002).
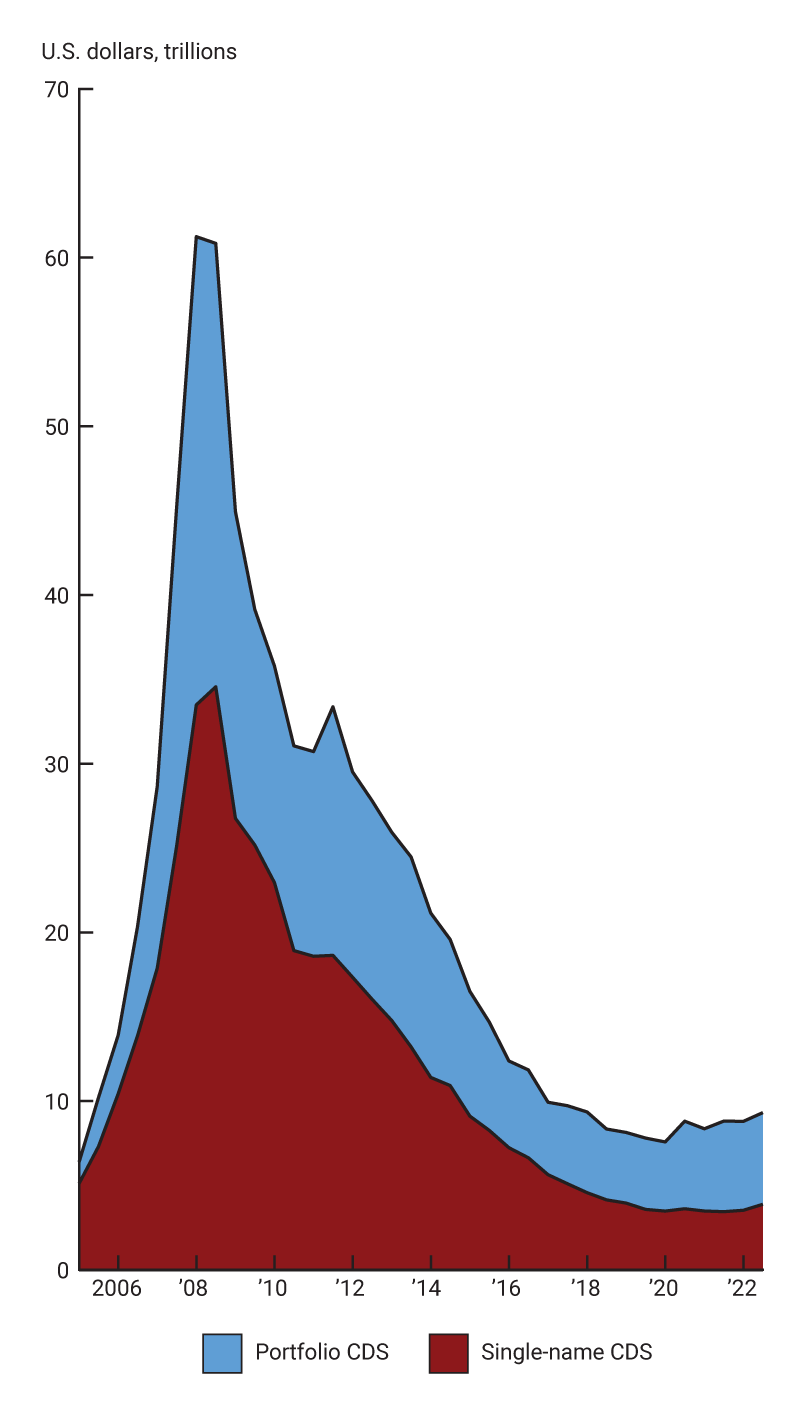
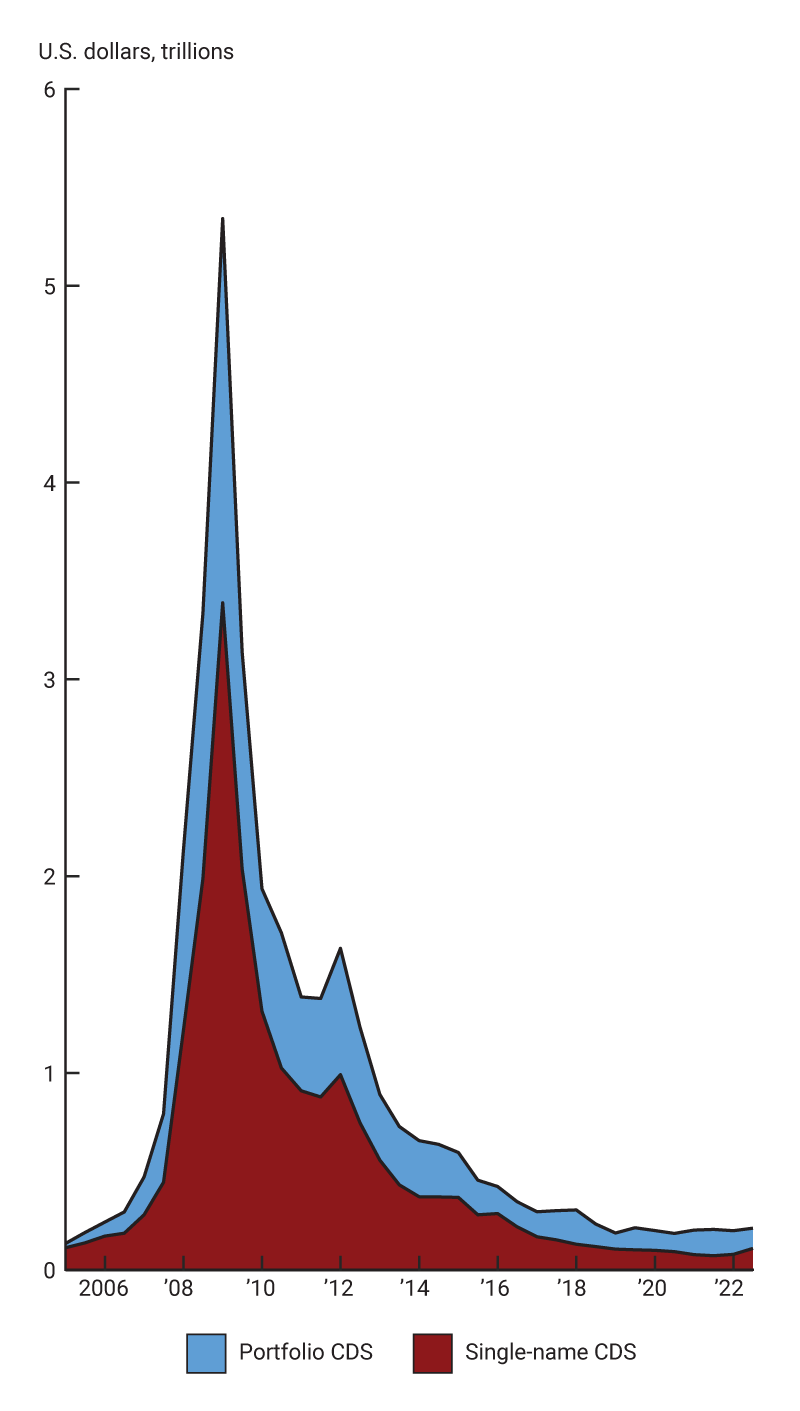
The CDS market has grown since its inception in the 1990s. Figure 1 shows that the CDS market increased significantly in the years prior to the Great Financial Crisis, with the total notional amount outstanding peaking above $67 trillion at the end of 2007 (see also Aldasoro and Ehlers, 2018). The continued evolution of CDS compression and netting, which reduce the number of contracts in credit portfolios without changing the portfolio’s underlying risk, contributed to a stark reduction in the gross notional amount from the 2008 financial crisis to $7.8 trillion by mid-2019.3 More recently, growth has been picking up again and notional CDS outstanding had increased to $9.3 trillion by June 2022.4 Prior to the financial crisis, the CDS market traded over-the-counter, i.e., trading occurred between two parties away from an exchange with terms conforming to the standards set by the International Swaps and Derivatives Association (ISDA). As a result of the global reforms introduced after the crisis, the majority of CDS are now traded on swap execution facilities (SEFs) and cleared at central counterparties (CCPs) regulated by the Commodity Futures Trading Commission (CFTC) for swaps5 or the U.S. Securities and Exchange Commission (SEC) for security-based swaps.6 As of 2022, CDS traded on SEFs represented 82.6% of total CDS notional and 87.1% of total trade count, while CDS cleared on CCPs represented 83.7% of total credit derivatives traded notional and 88% of total trade count.7
1. CDS market size
A. Total notional
B. Total gross market value
Contracts on sovereign reference entities comprise around 13% of the overall CDS universe, with a notional outstanding amount of $1.2 trillion in June 2022.8 Within the sovereign CDS asset class, trading is typically concentrated in contracts that reference debt obligations of emerging market economies, such as Argentina, Brazil, Mexico, Russia, and Turkey (e.g., Bomfim, 2022). However, there have been exceptions, such as the eurozone crisis of 2009–10 when there were high volumes of trading in CDS referencing the sovereign debt of advanced European economies, in particular those referencing the sovereign debt of Italy or Greece.
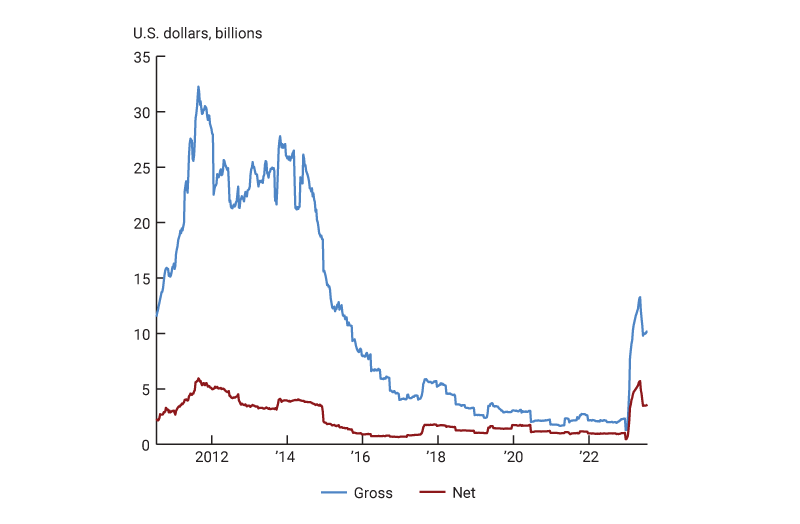
The market for U.S. sovereign CDS contracts is much smaller than the broader corporate and sovereign CDS markets. Boyarchenko and Shachar (2020) document that the gross notional value of total outstanding CDS positions on U.S. sovereign debt peaked at $32.3 billion in August 2011, around the time when Congress passed the Budget Control Act that resolved the 2011 debt ceiling episode. Trading activity declined significantly thereafter, with pockets of growth around the debt ceiling episode of 2013. By the fourth quarter of 2021, total gross notional value had reached its lowest level of $1.3 billion outstanding, down from around $26 billion in the fourth quarter of 2013. As such, while the market for U.S. sovereign CDS contracts is often characterized by periods of very low activity for long periods of time, it sees sharp swings of relatively elevated activity around debt ceiling episodes.
The 2023 debt ceiling episode brought renewed attention to the CDS market on U.S. sovereign debt. Figure 2 shows that the gross notional outstanding of CDS contracts referencing U.S. government debt started to increase in January 2023, reaching a peak of $13.3 billion during the week of May 12. While the gross amount of CDS outstanding remains below the levels registered in 2011 and 2013, the net notional amount increased to $5.7 billion the same week of May 12, higher than the $4.1 billion level reached in the week of October 25, 2013. As gross notional activity may at times overstate the economic exposure of the seller of protection to a default by the reference entity, net positions give a better estimate of the ultimate exposure, as they represent the aggregate payments to be made by the protection seller in the event of a default by the reference entity (see, e.g., International Organization of Securities Commissions, 2012).
2. U.S. sovereign CDS gross and net notional outstanding
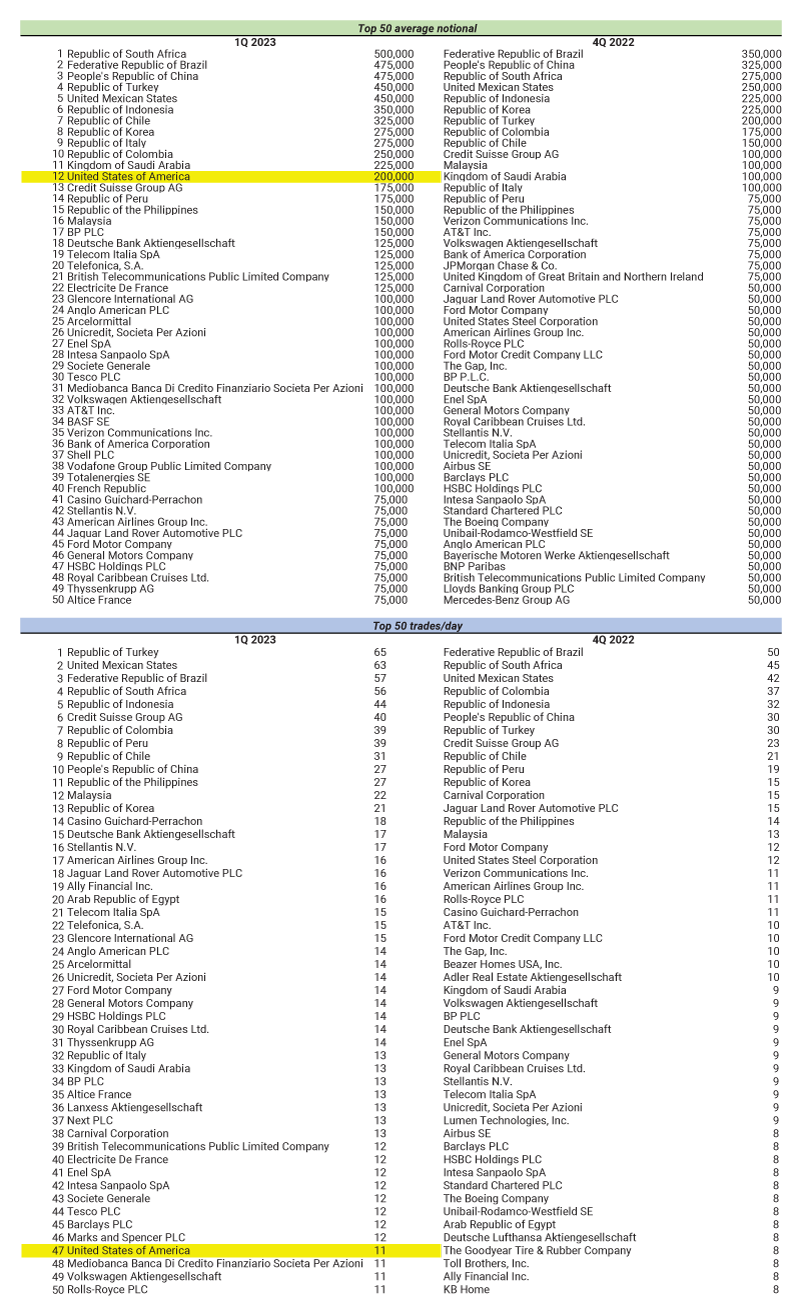
In addition to increases in notional amounts outstanding, broader trading activity increased significantly as well, as seen in figure 3. Gross weekly trading amounts peaked at $3 billion the week of February 3, 2023, corresponding to 103 traded contracts, before declining in subsequent weeks. These increases in trading activity are also evident in figure 4, which shows the top single-name CDS contracts by average notional (upper panel) and trades per day (lower panel) for the first quarter of 2023 and fourth quarter of 2022, respectively. When looking at average notional across the roughly 500 single-name entities tracked by the Depository Trust & Clearing Corporation (DTCC), the market for U.S. sovereign CDS contracts ranked 12th in the first quarter of 2023, increasing from 466th in the fourth quarter of 2022. In addition, during the fourth quarter of 2022, no U.S. sovereign CDS contracts traded during most weeks, while activity increased during the first quarter of 2023 to around 11 trades per day (47th by rank). Thus, while the overall amounts of U.S. sovereign CDS trading activity remain very small compared to other markets, such as the U.S. Treasury market, the expansion in trading activity for U.S. sovereign CDS has been significant relative to other single-name CDS activity.
3. U.S. sovereign CDS weekly trading activity
A. Gross weekly
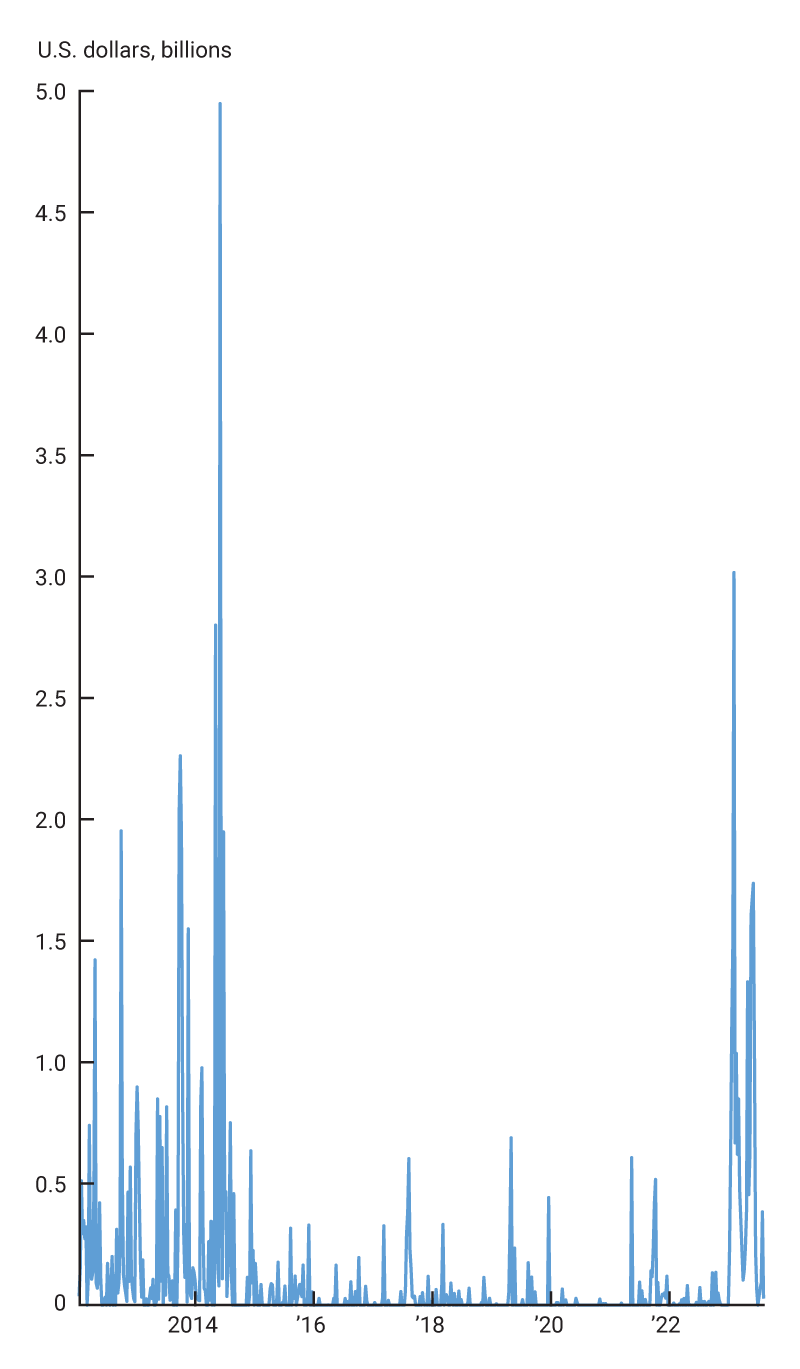
B. Contracts weekly
4. Trading activity in U.S. sovereign CDS, 2023:Q1 versus 2022:Q4
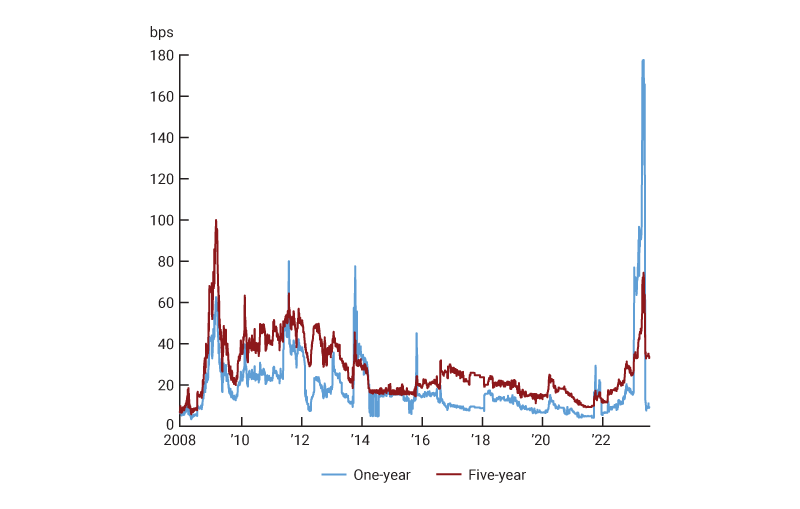
This surge in trading activity occurred as CDS premiums soared (figure 5), reaching 177 basis points (bps) on May 1, 2023, for the one-year CDS (tenor), roughly two to three times higher than the two previous major debt ceiling episodes of 2011 and 2013.9 In addition, the recent increases in CDS premiums pushed one-year CDS spreads above the five-year tenor. Normally, the quoted spread on the five-year CDS is higher than the one-year CDS due to generally greater uncertainty further into the future in terms of the probability of a credit event. The relative increase in one-year CDS reflects investors’ interest in seeking protection against a possible credit event in the short term, such as one related to the debt ceiling episode.
5. U.S. sovereign CDS premiums
These developments prompt the question: What does the recent run-up in U.S. sovereign CDS premiums and trading activity tell us about the underlying probability of a U.S. default? Moreover, is such a probability any different from that implied by U.S. sovereign CDS premiums observed before the debt ceiling episodes of 2011 and 2013?
To answer these questions, it is useful to clarify the cash flows generated by a CDS contract and how such expected payments map into a CDS premium, given market participants’ assessment of the likelihood of a default. To this end, in the next section we briefly discuss how CDS contracts are settled.
Settlement and cash flows
In a CDS, following a default by the reference entity, the protection buyer extracts value from the contract through physical or cash settlement. In the case of cash settlement, the protection buyer receives from the protection seller the cash value of the difference between the face value and the market value of an obligation of the reference entity. In the case of physical settlement, the protection buyer delivers to the protection seller an obligation of the reference entity that satisfies certain pre-agreed criteria (e.g., the reference obligation must be freely transferable with a maximum maturity of no more than 30 years),10 and the protection seller pays to the protection buyer 100% of the face value of the obligation. The protection buyer extracts value from this transaction because at the time of the default, the obligation will be worth less than 100% of its face value. If at the time of the default the reference entity has multiple bonds outstanding, then the protection buyer delivers to the protection seller the cheapest of the assets eligible for delivery, so as to maximize their cash flow upon default.
As the market evolved, participants started to use CDS contracts to trade based on their views on the riskiness of a specific company. The derivative nature of the CDS market made it possible to express a view on the likelihood of default of a reference entity without having to physically buy or sell its bonds, which may be illiquid and sometimes in limited supply. Consequently, the outstanding amount of CDS notional on a given entity at times exceeded that of the bonds outstanding by that entity, rendering physical settlement impractical. Eventually, settlement took the form of an auction mechanism that gives investors the option to cash or physically settle.11 The auction is designed to arrive at a market-wide settlement valuation of the current market value of the debt of the reference entity, while preventing manipulation of the auction results. In the auction, all market participants can deliver and purchase bonds of the defaulted entity. That means that if the size of the auction exceeds the amount of cheapest-to-deliver bonds that are deliverable, then those delivering into the auction will have to find the next cheapest to deliver, and so on. Hence, the price at which the auction settles is more of a blend of the deliverable obligations issued by the reference entity.
Had Congress failed to lift the debt ceiling, and had the U.S. been unable to make timely payments on its debt obligations,12 the Credit Derivatives Determination Committee (DC)13 would have then been tasked with ruling whether a credit event occurred, i.e., if payments should be made on CDS contracts. Moreover, the DC determines whether to hold an auction and what securities are deliverable into that auction. The outcome of such an auction would be affected by the valuation and availability of the cheapest deliverable bond.
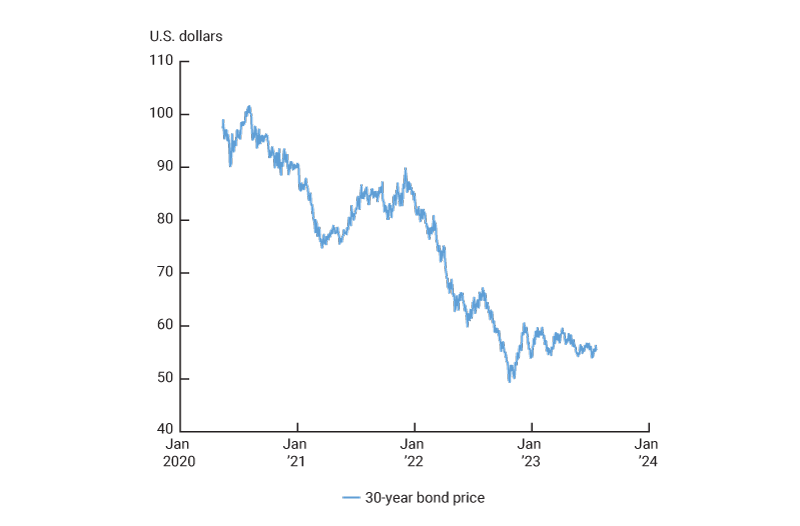
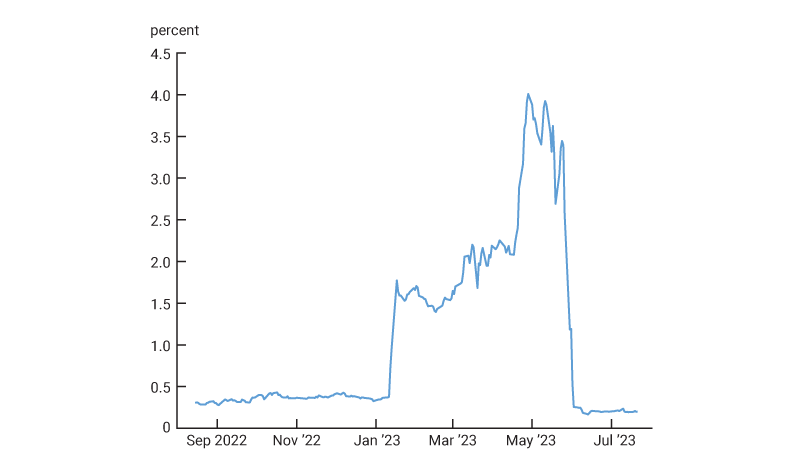
The cheapest-to-deliver bond typically changes on a day-to-day basis. During the 2023 debt ceiling episode, however, the cheapest deliverable into a hypothetical U.S. sovereign CDS auction was consistently the 30-year Treasury bond that matures on May 15, 2050.14 This bond was issued at a price close to par on May 15, 2020, at the height of the Covid-19 pandemic, with a coupon rate of only 1.25%. Since then, the Federal Open Market Committee (FOMC) has increased the federal funds rate, resulting in a marked increase in long-term Treasury yields and a corresponding decline in the prices of notes and bonds, especially those with long maturities that make low coupon payments. This is evident in the price history shown in figure 6: The price of the bond maturing in 2050 reached its lowest level of $49.4 on October 21, 2022, and subsequently hovered around $55 in spring 2023.
6. 30-year Treasury bond, May 15, 2050, maturity
The net notional outstanding in U.S. sovereign CDS contracts is small relative to that of Treasury bonds. For instance, there is more than $73 billion in Treasury bonds maturing on May 15, 2050. Although a fraction of these bonds are tied up in buy-and-hold portfolios of long-term investors, the sheer size of the issue dwarfs the $5.7 billion of net notional in U.S. sovereign CDS outstanding as of the week of May 12.15 Hence, it is reasonable to assume that, in case of a default, the CDS auction would have cleared at a price close to that of the cheapest-to-deliver bond.
In sum, the cash flows for a U.S. sovereign CDS contract are as follows. A protection buyer will be paying the CDS premium from the inception of the contract through either maturity or the sovereign “default,” whichever comes first. In CDS terminology, a default is called a “credit event.”16 In case of a credit event, the cash flow perceived by the protection buyer would approximately be the difference between $1 and the price of the cheapest deliverable per unit of face value times the notional amount of the CDS contract. The exact amount of that cash flow is unknown today, e.g., U.S. Treasury yields could have increased if market participants had feared that a breakdown of the negotiations on the debt ceiling was imminent. However, the price of the cheapest deliverable Treasury bond is, in present value, a reasonable estimate of the expected cash flow based on current information.
Compared to prior debt ceiling episodes, in 2023 the cheapest-to-deliver bond was deeply discounted. As a result, even in the case of a “technical default,” where the borrower is solvent but a payment is missed, the credit event language in CDS contracts could be triggered and settlement could follow, resulting in a potentially large payment to buyers of protection.
In the next section, we tie CDS premiums and their expected cash flow together with market participants’ assessment of the probability of a credit event.17
What do CDS premiums tell us about the likelihood of a default?
At the inception of the CDS contract, the buyer and the seller of credit derivative protection agree to a CDS premium such that the contract has zero market value. That is, the present value of CDS premium payments made by the protection buyer equals the present value of the payments made by the protection seller.
In a single-period model, and abstracting from transaction costs, this implies:
PV CDS premiums = p × PV cash flow (credit event)+(1 − p) × PV cash flow (no credit event),
where p denotes the risk-adjusted probability of a credit event and PV denotes the present value of a cash flow. In the case of no credit event, the protection seller of CDS insurance makes no payment, hence the “cash flow (no credit event)” term is zero. Thus, the CDS pricing equation simplifies into an expression for the risk-adjusted default probability,
\[p=\frac{\text{PV CDS premium}}{\text{PV cash flow (credit event)}}.\]
While the simple single-period example is useful to convey intuition, in practice CDS contracts involve prorated quarterly payments of the premium, and the default could occur at any time during the tenor of the contract. We explain our computations in more detail in the appendix.
Figure 7 shows our estimate of p during the 2023 debt ceiling episode. In 2022, the risk-adjusted default probability was fluctuating in a 30–40 bps range. However, beginning from January 2023, p spiked up to about 1.8% and continued to increase to about 4% through the end of April.18 The increase from the previous year is significant; it coincides with the heightened trading activity in U.S. sovereign CDS contracts (figures 2 and 3) and, of course, the spike in premiums (figure 5).
7. CDS implied default probability
On May 31, 2023, the U.S. House of Representatives passed the Fiscal Responsibility Act of 2023, which cleared the Senate on June 1, bringing the debt ceiling episode to a close. By June 2, one-year CDS premiums were down to about 10 bps, a level lower than the five-year CDS premium of approximately 35 bps. One-year default probabilities have been hovering around 20 bps since then (figure 7). Such a decline coincides with declining activity in the market for U.S. sovereign CDS contracts. Indeed, figure 3 shows a stark decline in contracts traded beginning the week of June 9, with only three contracts being traded in the weeks of July 14 and 21.
For comparison, we repeat a similar exercise for the periods leading up to the 2011 and 2013 debt ceiling episodes. To that end, we collect data on all Treasury securities issues that were outstanding at the time, and for each day we identify a hypothetical Treasury security that would have been cheapest to deliver in case of a default. Unlike the 2023 episode in which the cheapest-to-deliver security remained the same, such a security in 2011 and 2013 changed over time, rendering the default probability estimate noisier. To attenuate this problem, we use the average price of the cheapest deliverable bonds over the previous five calendar days. We then infer default probabilities from U.S. sovereign CDS prices, shown in figure 8. In the summer of 2011, p hovered around 4% before reaching a 6% peak shortly before the passing of the Budget Control Act of 2011, which brought the first of the two episodes to a conclusion on August 2. In the second episode, p peaked at 4% in the fall of 2013, shortly before the October 17, 2013, passing of the Continuing Appropriations Act, 2014, which put an end to the second episode.
8. CDS implied default probability
A. 2011 episode
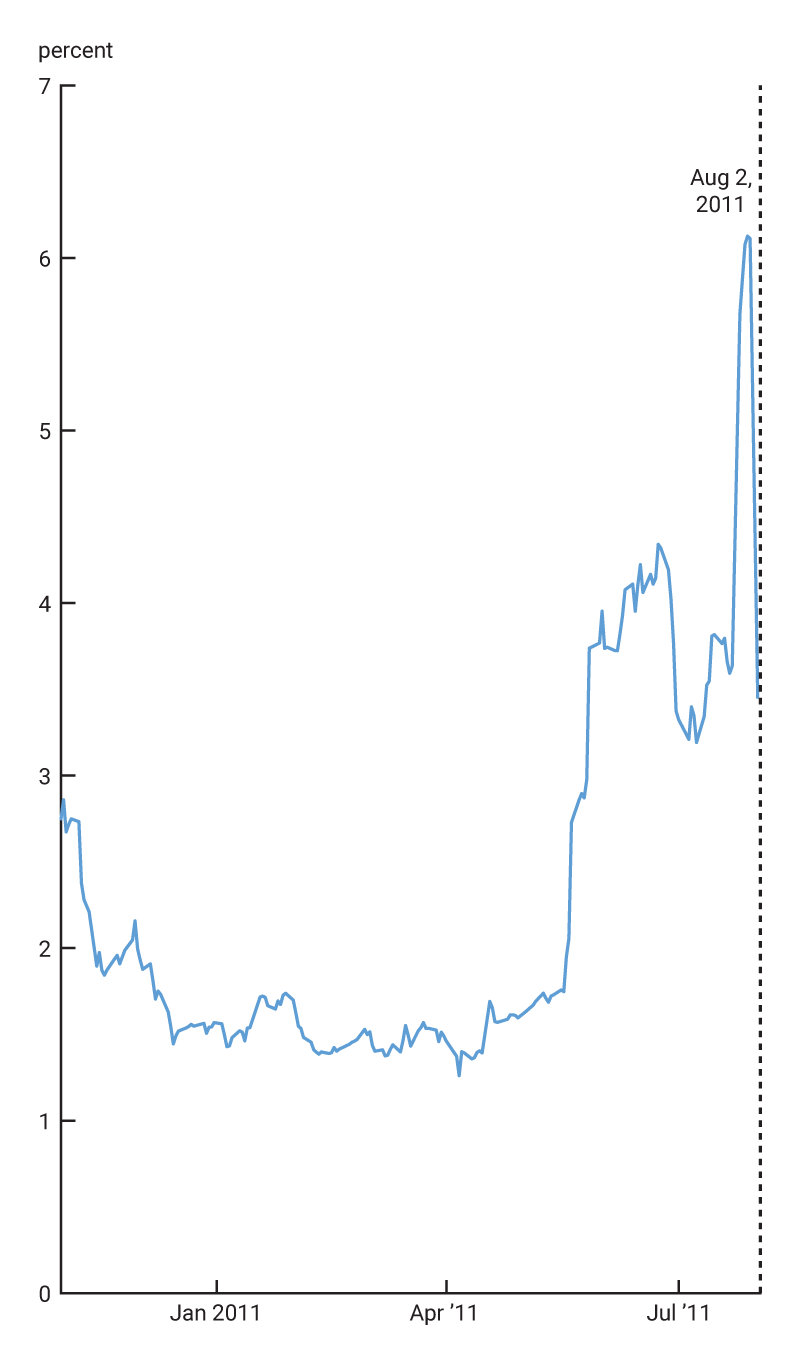
B. 2013 episode
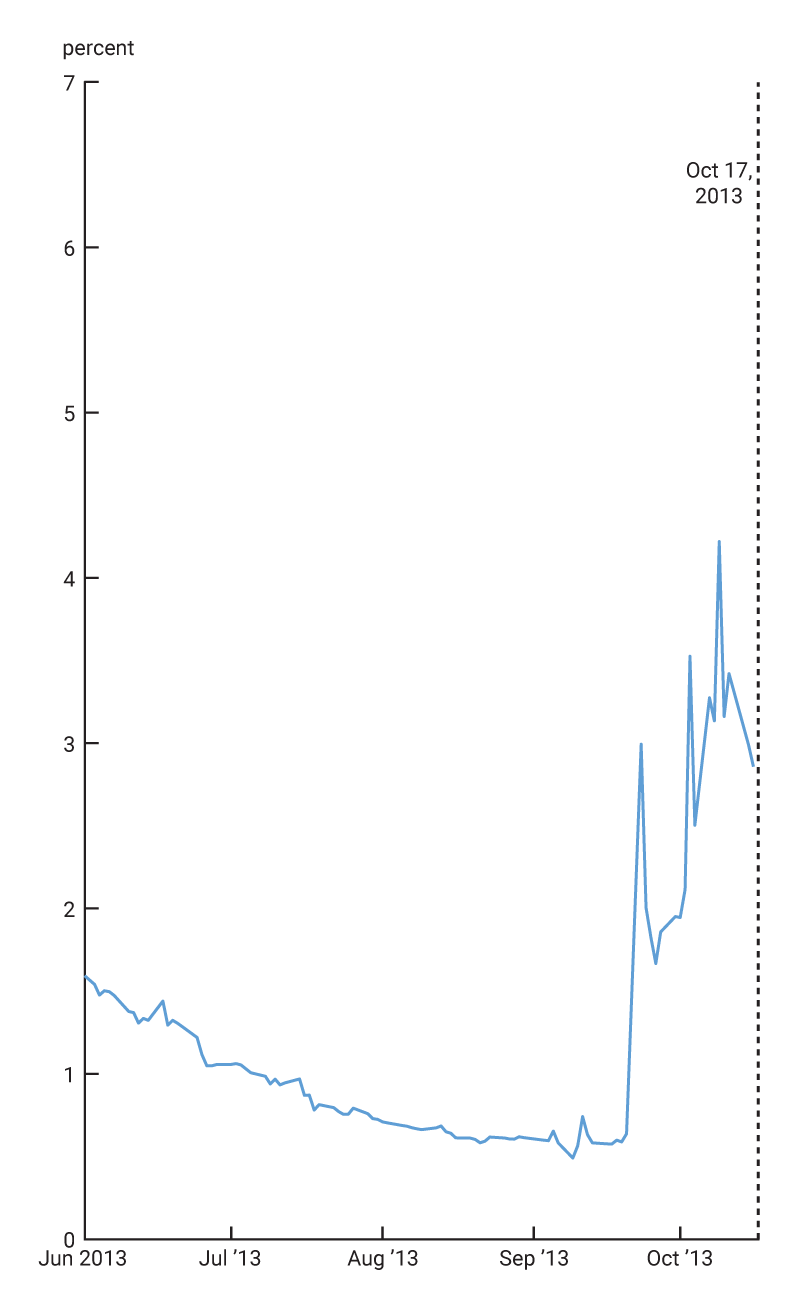
The p estimates computed for 2011 peak at a level higher than the 2023 estimates. In 2013, they were at a level similar to what we observed in 2023. Yet, 2023 CDS premiums have reached a level that is more than twice that observed in 2011 and 2013 (figure 5). This is because the CDS expected cash flow in case of a default is higher now than it was back then due to the significant discount at which long-term Treasury securities are currently trading. Hence, investors were paying more for protection in 2023 because of higher expected loss given default, but seemingly not because of higher expected default rates.
The debt ceiling and the market for U.S. Treasury bills
In this section, we highlight additional analysis of the 2023 debt ceiling episode by looking at other securities that are much more widely traded than U.S. sovereign CDS contracts. Of particular interest are Treasury bills expiring in the summer of 2023, when, absent congressional action, the Treasury’s extraordinary measures could have been exhausted. The risk of delayed payments on such securities could induce some market participants to avoid holding these securities in their portfolios in a debt ceiling episode. Such a shift in demand could push the prices of these Treasury bills down relative to those expiring at nearby maturities.
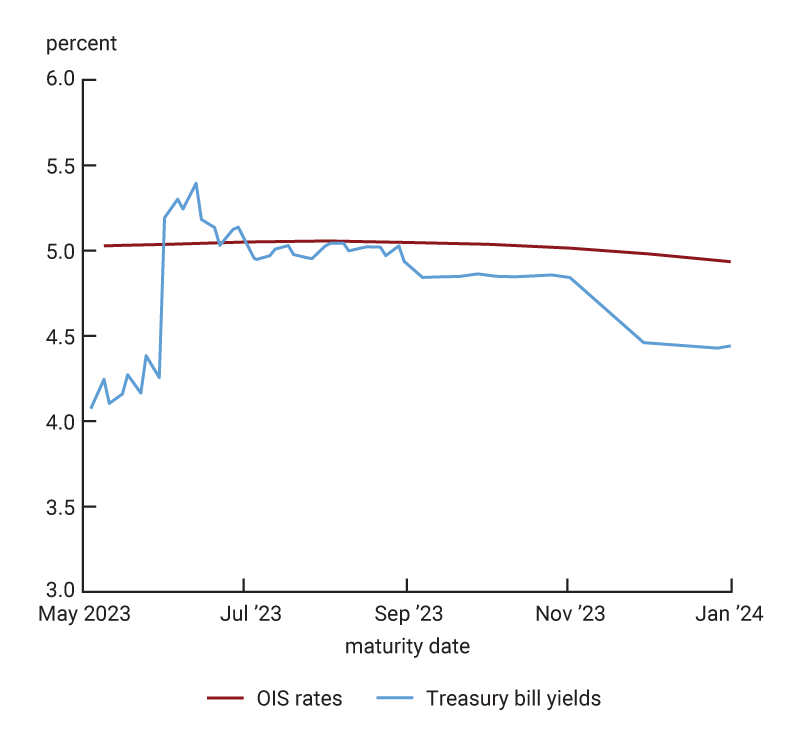
Panel A of figure 9 shows that as of April 28, 2023, U.S. Treasury bill yields increased into the summer, with a peak in August 2023. While yields may reflect a range of drivers, including expectations for future monetary policy by the FOMC, communication from the Treasury Department related to the debt ceiling may also affect near-term yields.19 Figure 9 also shows the term structure of overnight indexed swap (OIS) rates, which are less sensitive to the risk of a U.S. default. OIS rates are generally higher than Treasury bills yields in near-dated tenors maturing in late spring 2023 and for tenors maturing in the fall, but the spread shrinks to nearly zero for securities maturing in August.
Pricing in these metrics shifted significantly on May 2, shortly after Treasury Secretary Yellen wrote to Congress about the department’s estimate that the U.S. government would likely be unable to continue to satisfy all of its obligations potentially as early as June 1, absent congressional action to raise or suspend the debt limit. Panel B of figure 9 shows that the yields on Treasury bills maturing in June have become higher than the OIS rate.
9. Term structures of Treasury bill yields and OIS rates
A. Treasury bill yields and overnight indexed swap (OIS) rates as of April 28, 2023
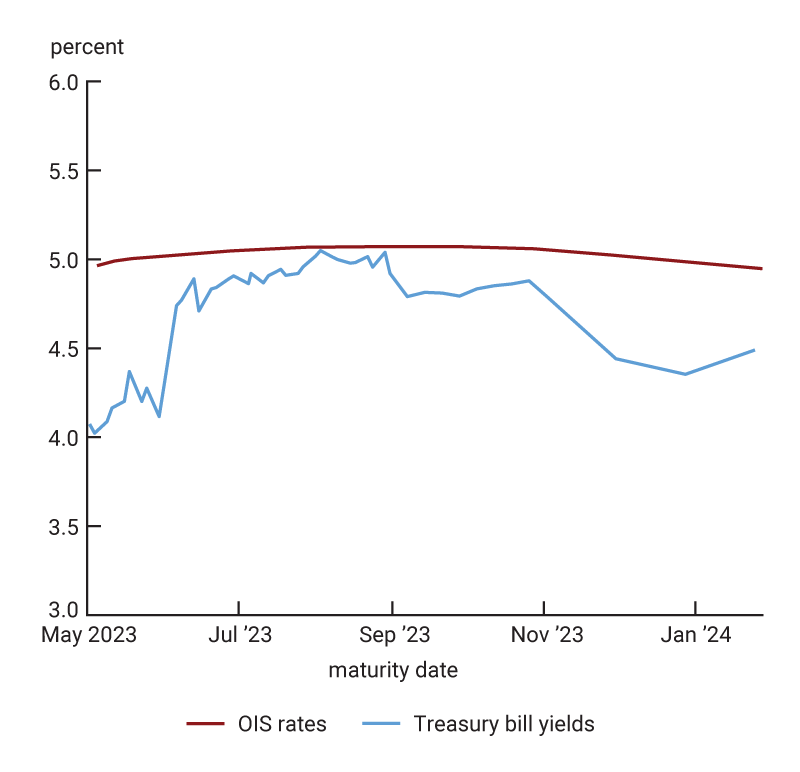
B. Treasury bill yields and overnight indexed swap (OIS) rates as of May 2, 2023
Conclusion
As the 2023 debt ceiling episode played out, we inferred the likelihood of a U.S. default through the lens of the sovereign CDS market. We document a significant increase in U.S. sovereign CDS trading, accompanied by a spike in premiums beginning in January 2023. Accordingly, we estimate an increase in the risk-adjusted default probability from about 0.3–0.4% in 2022 to approximately 4% in April 2023. Such an estimate is similar to what we find in the weeks leading up to the resolution of the 2013 debt ceiling episode and lower than the 6% estimate that we find in the fall of 2011. As the Fiscal Responsibility Act of 2023 brought the debt ceiling episode to a close in early June, our default probability estimates fall to near-zero levels. Moreover, trading activity declined in June and was starkly lower in July, with only three contracts traded in each of the weeks ending on July 14 and 21.
One important implication from this analysis is that a simple comparison of historical CDS spreads to gauge market expectations around the likelihood of a credit event could be complicated by the value of the cheapest deliverable bond. It is possible that any missed payment in case of a U.S. default would have been technical and eventually cured. However, in 2023 the cheapest-to-deliver bond was deeply discounted compared to prior debt ceiling episodes. Hence, due to the nature of the CDS market, in case of default contracts would have settled at a big loss, contributing to wider U.S. sovereign CDS spreads.
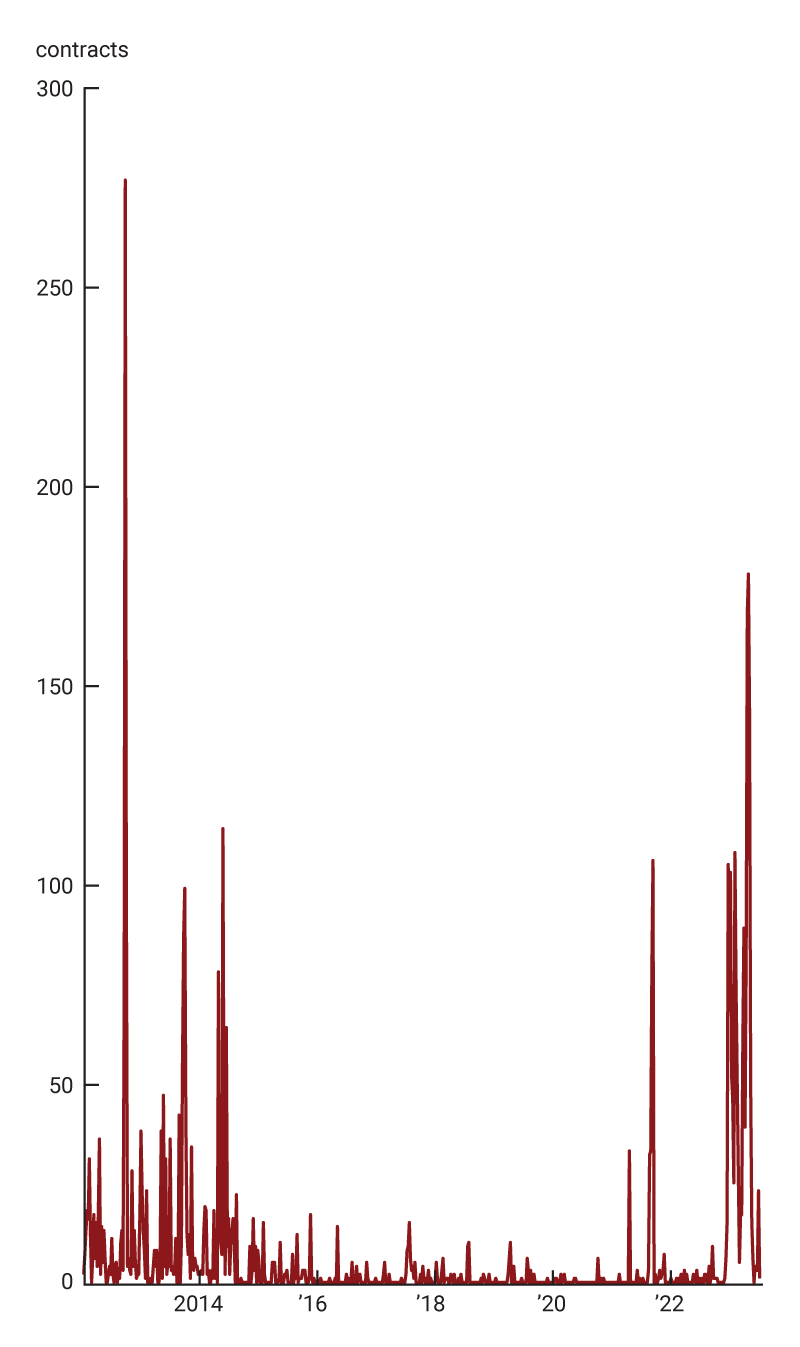
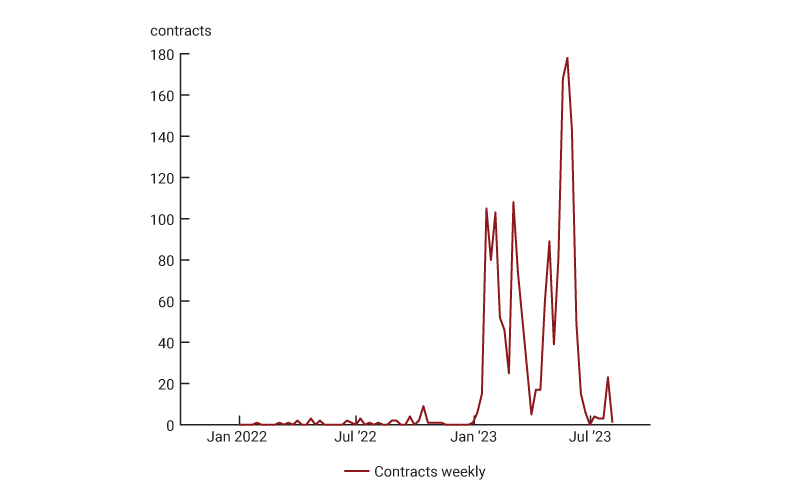
Another related point is that the market for U.S. sovereign CDS contracts has been largely dormant in recent years but saw a surge in activity during debt ceiling negotiations. Figure 10 shows that there was almost no activity during 2022, with no U.S. sovereign CDS contracts traded during most weeks and only one to nine contracts traded in other weeks. However, trading and overall activity increased sharply in the first part of 2023, peaking during the week of May 26, with 178 U.S. sovereign CDS contracts traded. This trading activity decreased again after the passing of the Fiscal Responsibility Act of 2023 that put an end to the debt ceiling episode, with the number of contracts traded dropping to three to four per week during most of July 2023.20 During weeks of active trading, U.S. sovereign CDS premiums have fluctuated in sync with the news flow, documenting progress and setbacks in debt ceiling negotiations.
10. Weekly trading activity in U.S. sovereign CDS during 2022–23
Of course, our results are subject to caveats and clarifications. For instance, the probability p accounts for the adjustment that market participants make due to the uncertainty of a default and the actual loss given default, and their aversion to the risk surrounding these events. Such an adjustment could be sizable. First, the returns on a fixed-income investment are typically negatively skewed, with upside limited by the face value of the bond. Second, in the event of a credit event, other assets would also likely fare poorly. Hence, there is risk in a short CDS position that is difficult to diversify away, and protection sellers will adjust the default probability upward, thereby increasing the CDS premium. That is, the actual default probability is likely smaller than the risk-adjusted measure p that appears in the CDS pricing equation.
Additionally, a majority of U.S. sovereign CDS contracts are denominated in euros. Hence, their premiums could partially reflect expectations for a devaluation of the dollar in the event of a U.S. default, as observed in other sovereign CDS that trade in foreign currencies (see, e.g., Augustin, Chernov, and Song, 2020; Brigo, Pede, and Petrelli, 2019; Chernov, Schmid, and Schneider, 2020). An assumption implicit in our comparison of risk-adjusted default probabilities over time is that market expectations for the move in the exchange rate given a U.S. default have not changed materially across debt ceiling episodes.
Our analysis relies on U.S. sovereign CDS premiums as a gauge of default risk. While trading activity has recently increased, the market for U.S. sovereign CDS contracts remains very small compared with the size of the market for U.S. debt. Hence, the implied default probabilities likely reflect the activity of a fairly small group of specialized investors, rather than a wider consensus across the broader public. In this respect, as discussed in the previous section, the term structure of Treasury bills that mature in the summer of 2023 provides a wealth of information concerning the recent debt ceiling episode that complements what we learn from U.S. CDS contracts. Finally, our risk-adjusted default probability estimates pertain to a scenario in which, upon a default event, the financial system is still functioning, and the sellers of credit protection are able to fulfill their contractual obligations.
We are also left with open questions. For instance, this research does not delve into who the actual holders of U.S. sovereign CDS are or what their motivations for trading these contracts are, e.g., whether they are hedging their own exposures to default risk or trading for other reasons. Learning more about the players in this market would also help us better understand the motivations and drivers during periods of increased activity in a market that is usually very illiquid.
Notes
1 We are grateful to Gene Amromin, Federico Bandi, Gadi Barlevy, Lorenzo Garlappi, Bob Goldstein, Patrick Greenfield, Kevin Henry, Gabriel Herman, Tom King, David Lando, Spencer Krane, Jordan Pollinger, Olga Roman, Robert Steigerwald, Fabrice Tourre, Dan Sullivan, Marcelo Veracierto (the editor), Kyle Watson, Josh Younger, and seminar participants at the 2023 Advances in Financial Econometrics Conference for many insightful comments. Max Gillet provided outstanding research assistance. Julia Baker, Han Choi, Helen Koshy, and Sheila Mangler provided excellent editorial assistance. All errors and omissions are our own. The latest version of our paper is available online.
2 See Debt Limit | U.S. Department of the Treasury.
3 See table D10.1 by the Bank for International Settlements (2019) with OTC, credit default swaps, by type of position as of June 2019. See also International Swaps and Derivatives Association (2023).
4 See table D10.1 (Bank for International Settlements, 2022, p. 9).
5 For the definition of swap, see U.S. Code, Title 7, Chapter 1, Section 1a(47)(A), available online. Index swaps referencing more than nine reference entities are regulated by the CFTC; see, e.g., Commodities Futures Trading Commission and Securities and Exchange Commission (2012).
6 Security-based swaps are single-name swaps referencing one reference entity, or narrow-index swaps, meaning swaps referencing nine or less reference entities. For single-name swaps, see U.S. Code, Title 7, Chapter 1, Section 78c(a)(68), available online, and for narrow-based security index swaps, see U.S. Code, Title 7, Chapter 1, Section 1a(35), available online.
7 See graph A.6 in Bank for International Settlements (2022, p. 8), and International Swaps and Derivatives Association (2023).
8 See table D.10.4 in Bank for International Settlements (2023).
9 The press and financial analysts have taken an interest in the evolution of U.S. sovereign CDS premiums and the increased activity in the market for U.S. sovereign CDS contracts. See, e.g., Wigglesworth (2023) and research by Barclays, Credit and Rates Strategy (Willemann et al., 2023). Both pieces discuss the effect of these market developments on the implied probability of a U.S. default.
10 See, e.g., International Swaps and Derivatives Association (2011).
11 Markit and Creditex provide a primer on the CDS settlement mechanism, available online. Chernov, Gorbenko, and Makarov (2013) study the implications of the two-step auction mechanism that allows for cash and physical settlement. See also Williams et al. (2007).
12 Other countries have experienced sovereign debt crises that have ended in other forms of default. Examples include debt repudiation or a moratorium on debt payments (e.g., Russia in 1998), and debt restructuring (e.g., Greece in 2012).
13 In 2018, ISDA appointed DC Administration Services Inc. (DCAS) as the Determination Committees’ Secretary. The most recent website for the Determination Committees is available online.
14 Based solely on pricing and not taking into consideration the availability or scarcity of this security.
15 In fact, there is an additional $89 billion outstanding in the 30-year Treasury bond maturing on August 15, 2050. That bond has a coupon rate of 1.375% and trades at a price only slightly higher than that of the cheapest deliverable.
16 The U.S. sovereign CDS trades on the ISDA standard terms for European sovereigns. Credit events for this type of sovereign reference entities are: failure to pay, repudiating or imposing a moratorium, and restructuring of outstanding debt in excess of $10 million. See the ISDA Credit Derivatives Settlement Matrix, available online.
17 Chernov, Schmid, and Schneider (2020) develop an equilibrium macrofinance model to examine whether U.S. sovereign CDS premiums reflect the probability of a fiscal default—a state in which a balanced budget can no longer be restored by raising taxes or eroding the real value of debt by increasing inflation. They conclude that their calibrated model is consistent with elevated levels of CDS premiums but leaves dynamic implications quantitatively unresolved. Klingler and Lando (2018) note that CDS can be used to lower the capital requirements of dealer banks entering into uncollateralized derivatives positions with sovereigns. They propose a model in which CDS premiums depend on margin requirements for the seller and the buyer of CDS protection, capital requirements of the dealer bank, and limits on leveraged investment in the risky asset.
18 The first jumps took place on January 11–17, 2023; over those days it had become known that the U.S. was going to reach its debt limit by January 19. For instance, on January 13, U.S. Secretary of the Treasury Janet Yellen sent a letter to all members of congressional leadership regarding the debt limit, available online. The financial press quickly reacted to the news; see, e.g., Thomson Reuters on January 17, available online.
19 See the Debt Limit Letter to Congress Members 20230515 McCarthy (treasury.gov).
20 During the week of August 1, 2023, when Fitch Ratings downgraded the U.S. government credit rating to AA+, liquidity was also poor, with only four contracts being traded.
Appendix: Computation of the CDS-implied probability of a U.S. default
In this appendix we discuss the computation of the CDS-implied probability of a U.S. default in more detail. Without loss of generality, we focus on a one-year CDS contract, which is the case we consider in this article.
In a CDS contract, the protection buyer makes quarterly payments in the amount of the protection premium.i The yearly premium is prorated over three-month periods and paid out on the 20th of the last month of each quarter (March 20, June 20, September 20, and December 20).
Following Sundaresan (2009), denote s(i) the risk-adjusted probability that the reference entity survives through quarter i. Moreover, assume that the protection buyer and seller do not default on their obligationii on a CDS contract with $1 notional amount, and denote by c the yearly CDS premium. Then the expected present value of the premiums on a one-year CDS contract is:
$\text{A}1)\quad\sum\limits_{i=1}^{4}{s(i)\,{{B}_{0}}(i)\frac{c}{4},}$
where ${{B}_{0}}$(i) denotes the time 0 price of a risk-free zero-coupon bond that matures in quarter i with face value equal to one. In equation A1, multiplying the prorated CDS premiums c/4 by ${{B}_{0}}$(i) yields the present value of the payments discounted at the risk-free rate to time 0, when the two parties enter the contract. Weighing such payments by the risk-adjusted survival probability s(i) yields the expected value of such payments. Due to the risk of a breakdown in the debt-ceiling negotiations, Treasury securities are not risk free in our analysis. Moreover, outside of debt ceiling episodes, Treasury securities often trade below a hypothetical risk-free rate due to their liquidity and safety-asset status. Thus, it is common to use another rate in these present value computations, e.g., the term structure of swap rates.
In case of a credit event during quarter i, the protection buyer is responsible to pay the premium prorated through the default date. For illustration, assume that a credit event always occurs in the middle of the quarter, i.e., February 15, May 15, August 15, or November 15, and denote by p(i) = s(i − 1) − s(i) the risk-adjusted probability that the reference entity defaults in quarter i. Then, in addition to the expected value of the payments in equation A1, the protection buyer is responsible to pay the expected present value of the premiums associated with a credit event:
$\text{A}2)\quad\sum\limits_{i=1}^{4}{p(i){{B}_{0}}\left( i-\frac{1}{2} \right)}\frac{1}{2}\frac{c}{4},$
where the discount factor ${{B}_{0}}\left( i-\frac{1}{2} \right)$ applies to the prorated premium cash flow that matures upon default in the middle of quarter i.
The sum of the expressions in equations A1–A2 yields the present expected value of all payments made by the protection buyer to the seller:
$\text{A}3)\quad\sum\limits_{i=1}^{4}{s(i){{B}_{0}}(i)\frac{c}{4}+\sum\limits_{i=1}^{4}{p(i){{B}_{0}}\left( i-\frac{1}{2} \right)}\frac{1}{2}\frac{c}{4}.}$
On the other hand, in case of a credit event the protection seller is responsible to make the protection buyer whole by paying the “loss given default” (LGD), i.e., the amount of money that the buyer lost on the reference entity. The expected present value of such payment is:
$\text{A}4)\quad\sum\limits_{i=1}^{4}{p(i){{B}_{0}}\left( i-\frac{1}{2} \right)LGD.}$
For ease of exposition, equation A4 assumes that LGD is constant. In practice this assumption is violated because, in case of default, LGD is determined by the CDS auction based on the price of the cheapest deliverable bonds. Thus, we approximate the present value of the loss given default with the difference between the face and the market values of the cheapest deliverable Treasury security on each given day.iii
The CDS premium is the fixed payment c that equals the expected payments made by the protection buyer and seller,
$\text{A}5)\quad\sum\limits_{i=1}^{4}{s(i){{B}_{0}}(i)\frac{c}{4}+\sum\limits_{i=1}^{4}{p(i){{B}_{0}}\left( i-\frac{1}{2} \right)\frac{c}{8}=LGD\sum\limits_{i=1}^{4}{p(i){{B}_{0}}\left( i-\frac{1}{2} \right),}}}$
which yields:
$\text{A}6){\quad}c=\frac{LGD\sum\nolimits_{i=1}^{4}{p(i){{B}_{0}}\left( i-\frac{1}{2} \right)}}{\sum\nolimits_{i=1}^{4}{s(i){{B}_{0}}(i)\frac{1}{4}+\sum\nolimits_{i=1}^{4}{p(i)}}{{B}_{0}}\left( i-\frac{1}{2} \right)\frac{1}{8}}.$
In our exercise, we observe daily realizations of the U.S. sovereign CDS premium c, as well as the discount factors ${{B}_{0}}$(i), i = 1, 2, 3, and 4. From these inputs, we seek to estimate the survival probabilities s(i), and the associated default probabilities p(i) = s(i − 1) − s(i). Given the number of unknown variables, some assumptions are necessary to solve the problem.
If a U.S. default were to occur, most likely it would be due to Congress’s inability to lift the debt ceiling before the Treasury runs out of money. There is no certain deadline for this to happen, but many estimates fall in the middle of the summer. Hence, we focus on the possibility that the U.S. might default on August 15, and denote such probability by p. In contrast, we assume that the likelihood of a default on any other date is zero. With these assumptions, in equation A5, s(i) = 1 and p(i) = 0 in quarters that precede the summer of 2023, s(i) = 1 − p and p(i) = p in the summer of 2023, and s(i) = 1 − p and p(i) = 0 in quarters that follow the summer of 2023.
To illustrate, consider the case of a CDS contract created at the beginning of January 2023. In this example, we assume that there will be no default in 2023:Q1 and 2023:Q2. In 2023:Q3, there is a probability p of default, and thus a survival probability of (1 − p). We assume that if the U.S. avoids default in 2023:Q3, then there will be no default in Q4. Hence, the probability that the U.S. will survive through the end of 2023:Q4 is (1 − p). Substituting into equation A5, we obtain:
$\text{A}7)\quad{{B}_{0}}(1)\frac{c}{4}+{{B}_{0}}(2)\frac{c}{4}+\left( 1-p \right){{B}_{0}}(3)\frac{c}{4}+\left( 1-p \right){{B}_{0}}(4)\frac{c}{4}+p{{B}_{0}}(2.5)\frac{c}{8}=p{{B}_{0}}(2.5)LGD.$
The timing associated with the discount factor ${{B}_{0}}$(2.5) refers to the fact that, in this example, we assume that the default occurs in the middle of a quarter and settlement of the cash flows upon default is immediate. That is, i = 2.5 refers to the midpoint between the end of quarters 2 and 3. In practice, the CDS auction has to take place prior to the settlement of the payments. While our approach abstracts from this friction, we do not expect the results to be materially affected. We then solve equation A7 for the only unknown term p.
Appendix Notes
i Many CDS contracts are standardized so that the running CDS premium, paid quarterly in arrears, is fixed across entities with the same credit rating (e.g., 100 bps for investment-grade companies), while any adjustment to the fixed running premium is settled in advance shortly after the inception of the contract. The adjustment to the running premium is computed using market conventions for a recovery rate. This practice helps to simplify netting.
ii In practice, collateral provides protection against counterparty risk.
iii Implicit in our calculation is the assumption of independence between the risk-free rate and the default event. In practice, the risk-free discount rate could have increased if market participants feared an imminent default. However, the price of the cheapest deliverable Treasury bond is, in present value, a reasonable estimate of the expected cash flow based on current information.
References
Aldasoro, Iñaki, and Torsten Ehlers, 2018, “The credit default swap market: What a difference a decade makes,” BIS Quarterly Review, June, pp. 1–14, available online.
Augustin, Patrick, Mikhail Chernov, and Dongho Song, 2020, “Sovereign credit risk and exchange rates: Evidence from CDS quanto spreads,” Journal of Financial Economics, Vol. 137, No. 1, July, pp. 129–151. Crossref
Bank for International Settlements, 2023, “OTC derivatives outstanding,” data set, Basel, Switzerland, updated May 17, available online.
Bank for International Settlements, 2022, “OTC derivatives statistics at end-June 2022,” statistical release, Basel, Switzerland, November 30, available online.
Bank for International Settlements, 2019, “OTC, credit default swaps, by type of position,” table D10.1, Basel, Switzerland, available online.
Bomfim, Antulio N., 2022, “Credit default swaps,” Finance and Economics Discussion Series, Board of Governors of the Federal Reserve System, No. 2022-023, May. Crossref
Boyarchenko, Nina, and Or Shachar, 2020, “The evolving market for U.S. sovereign credit risk,” Liberty Street Economics, Federal Reserve Bank of New York, blog, January 6, available online.
Brigo, Damiano, Nicola Pede, and Andrea Petrelli, 2019, “Multi-currency credit default swaps,” International Journal of Theoretical and Applied Finance, Vol. 22, No. 4, June. Crossref
Chernov, Mikhail, Alexander S. Gorbenko, and Igor Makarov, 2013, “CDS auctions,” Review of Financial Studies, Vol. 26, No. 3, March, pp. 768–805. Crossref
Chernov, Mikhail, Lukas Schmid, and Andres Schneider, 2020, “A macrofinance view of U.S. sovereign CDS premiums,” Journal of Finance, Vol. 75, No. 5, October, pp. 2809–2844. Crossref
Cocco, Alessandro, 2002, “Credit derivatives 2002: Fundamentals and latest developments in credit derivatives documentation techniques,” Journal of Derivatives & Hedge Funds (formerly Derivatives Use, Trading & Regulation), Vol. 8, No. 3, pp. 267–281.
Commodity Futures Trading Commission, and Securities and Exchange Commission, 2012, Federal Register, Vol. 77, No. 156, Part II, August 13, pp. 48208–48366, available online.
International Organization of Securities Commissions, 2012, “The credit default swap market,” report, FR05/12, Madrid, Spain, June, available online.
International Swaps and Derivatives Association, 2023, “SwapsInfo full year 2022 and the fourth quarter of 2022 review,” report, New York, NY, February, available online.
International Swaps and Derivatives Association, 2011, Credit Derivatives Physical Settlement Matrix, New York, NY, January 20, available online.
Klingler, Sven, and David Lando, 2018, “Safe haven CDS premiums,” Review of Financial Studies, Vol. 31, No. 5, May, pp. 1856–1895. Crossref
Sundaresan, Suresh, 2009, Fixed Income Markets and Their Derivatives, Cambridge, MA: Elsevier / Academic Press.
Wigglesworth, Robin, 2023, “Does Treasury bedlam beckon?,” Financial Times, March 8, available online by subscription.
Willemann, Soren, Jigar Patel, Anshul Pradhan, and Andres Mok, 2023, “FAQs on USA sovereign CDS—2023 edition,” Barclays, Macro & Credit Research, Credit and Rates Strategy, research report, March 8.
Williams, John, Doug Warren, Bryce Markus, David Moss, Robert Lee, Carlo-Edoardo Carlon, Athanassios Diplas, Glade Jacobsen, Justin Gmelich, William Roberts, Bryan Mix, Kimberly Summe, Tom Benison, Alessandro Cocco, Lisa Watkinson, Thomas Vogel, and Vincent Basulto: Inventors, 2007, “Systems and methods for credit default swap auction,” International Swaps and Derivatives Inc., U.S. patent, No. US 8,078,521 B1, July 30 (application granted on December 12, 2011), available online.


