

Inflation Considerations and the Monetary Policy Response
Panel remarks presented virtually on May 25, 2021, at the 2021 Bank of Japan–Institute for Monetary and Economic Studies Conference, Adapting to the New Normal: Perspectives and Policy Challenges after the COVID-19 Pandemic.
Introduction and disclaimer
Thank you for that introduction and the opportunity to participate alongside these distinguished panelists in today’s important discussion on the monetary policy challenges ahead. Before I begin, let me note that these views are my own and do not necessarily represent those of my colleagues on the Federal Open Market Committee (FOMC) or others in the Federal Reserve System.
Many commentators have warned that the U.S. economy is on a path to high inflation and that monetary policy should be repositioning to counter that. Yet this commentary often is pretty loose on the exact mechanisms generating the inflation. Analysts cite the risk of a seriously overheating U.S. economy and then invoke the specter of high inflation. But just how high and how persistent might these feared increases be? These obviously are crucial things for policymakers to understand and assess. So I want to talk about them today—in particular the roles that resource pressures and inflation expectations might play in the path for inflation over the next few years.
Inflation and developing resource gaps
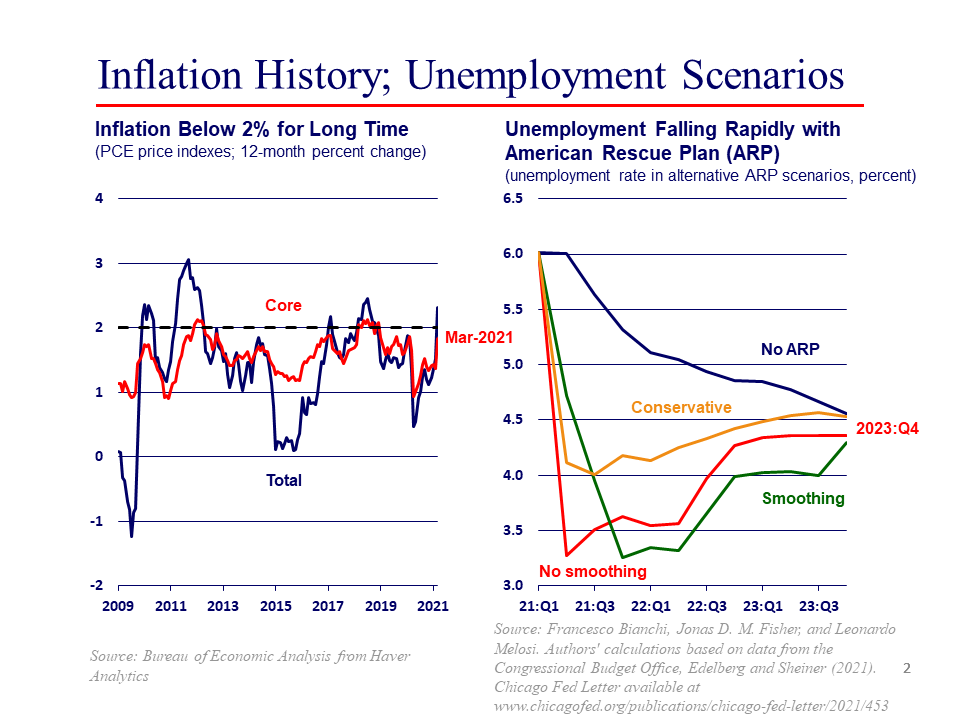
To set the stage, the FOMC has an average inflation target of 2 percent as measured by the Price Index for Personal Consumption Expenditures (PCE), which is shown in the left-hand panel of this chart.
As you well know, following the Great Financial Crisis, PCE inflation had only briefly reached 2 percent a couple of times prior to the pandemic. Inflation then plummeted as the pandemic depressed demand for many goods and services. Recently, in March, core inflation popped up to 1.8 percent,1 and given the latest Consumer Price Index (CPI) reading, we’re likely to see a big move up in April’s PCE inflation report.
The factors behind these increases are well known: the base effects of last year’s price declines dropping out of the 12-month calculation; the normalizing rebound of prices in sectors hard hit by the pandemic; and supply-side cost pressures associated with a fast-growing economy. And we certainly are hearing a lot about these cost pressures today. However, as challenging as they are for certain households and businesses, these developments largely reflect relative price changes to new equilibrium levels—and relative price changes by themselves have only transitory effects on inflation.
How should we assess the risks of a serious, longer-lasting inflation problem? Many commentators who argue that this higher inflation danger is right around the corner are doing so in reference to the recently enacted American Rescue Plan Act, or ARP. For example, Larry Summers (2021a, 2021b) has said the fiscal support is too big and will overheat the economy. But the precise inflation mechanisms and magnitudes are often left unstated.
Two economists on my staff, Jonas Fisher and Leo Melosi, along with Francesco Bianchi at Duke, went through an exercise to flesh out some representative mechanisms.2 They first considered the potential impact of the American Rescue Plan Act on the unemployment rate under a few scenarios regarding how much and how quickly appropriations from the plan might be spent.3
Their results are shown in the right-hand panel of the slide, along with the February 2021 baseline CBO forecast, which did not include the fiscal package. In each scenario, the unemployment rate falls quickly and significantly below baseline. The largest and most persistent impact is in what they call the smoothing scenario—in which the unemployment rate falls somewhat below its pre-pandemic level of 3.5 percent for three consecutive quarters, starting in the fourth quarter of 2021.4
Resource pressures and inflation
What are the consequences for inflation? Well, here you need a model that relates resource pressures to inflation. So Francesco, Jonas, and Leo ran each scenario through different versions of the workhorse inflation-expectations-augmented Phillips curve.
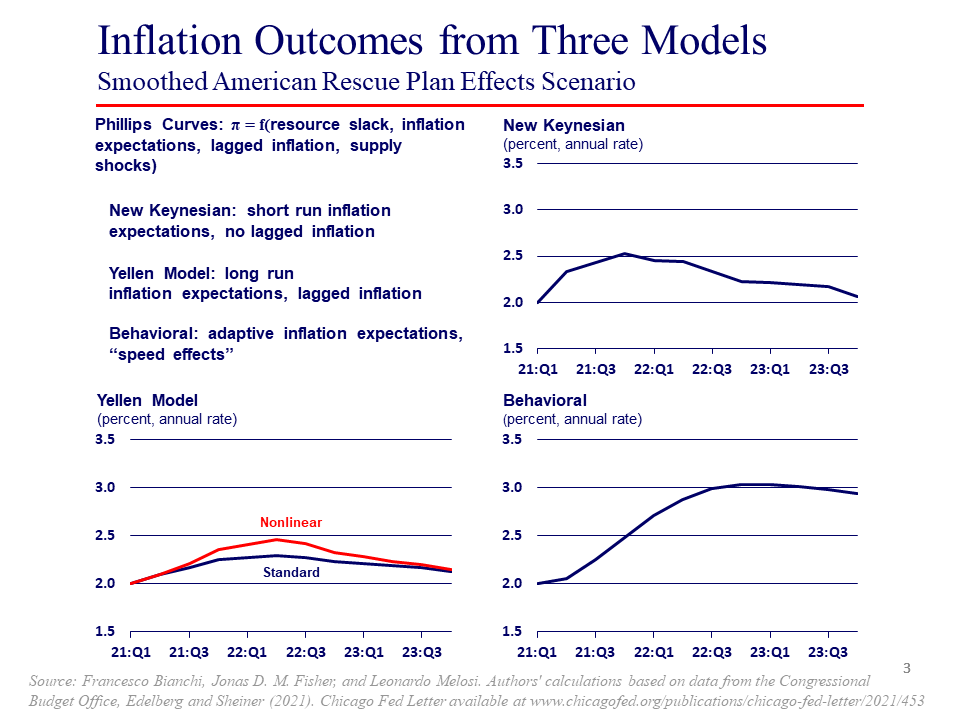
The first version is the New Keynesian Phillips Curve, which in addition to slack includes short-run inflation expectations, but has no lagged inflation in it. The second is a model from 2015 that Janet Yellen liked to use in her public discourse when she was Fed Chair. Its key differences from the New Keynesian model is its dependence on long-run inflation expectations and inclusion of lagged values of inflation. Francesco, Jonas, and Leo consider a linear version and a simple nonlinear specification in which resource pressures have larger effects on inflation at very low levels of unemployment.5 Their last specification is a behavioral model in which inflation expectations are adaptive—so higher actual inflation will boost expectations. The model also incorporates “speed effects,” in which not only the level of, but the change in, the unemployment gap influences inflation. This arguably proxies for things like supply-side bottlenecks that arise as an economy recovers quickly.
So, what did they find? Because the smoothing scenario generates a larger and more persistent output gap than the others, I’m going to concentrate on that case. If we had started off with inflation at our 2 percent average objective in the first quarter of 2021 rather than below it, in both the New Keynesian and Yellen models, PCE inflation tops out somewhere around 2-1/2 percent. And this modestly higher level doesn’t last that long, largely reverting to target in two or three years.
Only the behavioral model yielded some larger and persistently higher numbers. Here, PCE inflation increases to about 3 percent, and a feedback loop between higher actual inflation and inflation expectations meant the higher rate was largely maintained several years out.
Inflation expectations are key
The lessons from this exercise are well known. The coefficient on resource utilization in the Phillips curve is small, so that resource pressures on their own will have a limited impact on inflation.6 Furthermore, even these modest effects will go away as those pressures dissipate. To generate larger and persistently higher inflation, you need higher inflation expectations. Households and businesses must incorporate a higher underlying rate of inflation into their plans for the future; and as these plans take hold, they become embedded in actual inflation itself.
Now it turns out that the behavioral model’s feedback between actual inflation and inflation expectations was estimated using data that include the 1970s and ’80s. We “seasoned veterans” remember we usually estimated accelerationist Phillips curves for these periods. In these models the change—not the level—of inflation is driven by the output gap, so even if resource pressures were eliminated, inflation would remain at its new higher level. If resource pressures were maintained, inflation would continue to spiral upward. And theory gave us a very credible underpinning for this result: It could be explained by a strong and long-lasting sensitivity of inflation expectations to recent inflation experience.
It seems to me that such an accelerationist view is on the minds of many of those warning about an outbreak of inflation today. Once the burst of post-pandemic relative price level adjustments is behind us and with the impetus from fiscal support receding, the path to unacceptably high and persistent inflation in 2022 and beyond likely relies on an accelerationist story line.
I think this risk is low. Prior to the pandemic, when the unemployment rate was at a historically low 3.5 percent, inflation certainly wasn’t spiraling upward. Furthermore, given the low rates of inflation experienced over the past 15 years, inflation expectations likely drifted noticeably below 2 percent. However, even with their increases in recent weeks, survey measures and inflation compensation priced into Treasury rates over the five- to ten-year horizon are just back to where they were in 2013, which certainly are not levels suggesting inflation is spiraling out of control. And I’d emphasize that the market assessments are occurring in an environment where fiscal support and deficit financing are well known to investors. Indeed, I have to say that these increases have been welcome—if they persist, then they will help us make some real progress toward reaching our average inflation target.
Of course, measures of inflation expectations are imperfect. We need to watch all of the data very closely. The challenge will be to cut through the effects of temporary supply pressures and post-pandemic price renormalization to get a clearer picture of underlying inflation dynamics. This won’t be an easy task. But it is important to emphasize that the recent increase in inflation does not appear to be the precursor of a persistent movement to undesirably high levels of inflation. I have not seen anything yet to persuade me to change my full support of our accommodative stance for monetary policy or our forward guidance about the path for policy.
Thank you.
Notes
1 While the FOMC’s inflation objective is stated in terms of overall inflation measured by the Price Index for Personal Consumption Expenditures, core inflation—which strips out the volatile food and energy sectors—is a better gauge of sustained inflationary pressures and where inflation is headed in the future.
2 See Bianchi, Fisher, and Melosi (2021).
3 These scenarios, as summarized in Bianchi, Fisher, and Melosi (2021), are as follows.
- No smoothing: This path uses estimates of the impact on gross domestic product (GDP) from the various provisions of ARP from Edelberg and Sheiner (2021), along with assumptions about when the provisions will be spent. This path takes on board Karger and Rajan’s (2021) finding that the CARES Act checks sent to households were spent quickly.
- Smoothing: This path also uses the impact estimates from Edelberg and Sheiner (2021), but allocates the spending more gradually over time.
- Conservative: This path assumes a time pattern of spending similar to the no-smoothing case, but assumes smaller impact estimates.
For each scenario, the authors calculate the ARP-adjusted output gap expressed as the percentage point deviation of projected GDP from the Congressional Budget Office’s (CBO) estimate of potential. They then use Okun’s law to get an unemployment rate gap, and apply it to the baseline projection to generate an unemployment rate. They assume that the ARP has no impact on potential output.
4 The median FOMC participant’s most recent estimate of the longer-run unemployment rate is 4.0 percent; see Federal Open Market Committee (2021).
5 Yellen (2015).
6 As an example of recent work documenting this, I would point you to a paper by Hazell et al. (2021) that controls for simultaneity bias by analyzing state variation in prices for tradable goods and still finds that the Phillips curve is quite flat.
References
Bianchi, Francesco, Jonas D. M. Fisher, and Leonardo Melosi, 2021, “Some inflation scenarios for the American Rescue Plan Act of 2021,” Chicago Fed Letter, Federal Reserve Bank of Chicago, No. 453, April. Crossref
Edelberg, Wendy, and Louise Sheiner, 2021, “The macroeconomic implications of Biden’s $1.9 trillion fiscal package,” The Hamilton Project, Brookings Institution, blog post, January 28, available online.
Federal Open Market Committee, 2021, Summary of Economic Projections, Washington, DC, March 17, available online.
Hazell, Jonathon, Juan Herreño, Emi Nakamura, and Jón Steinsson, 2021, “The slope of the Phillips curve: Evidence from U.S. states,” National Bureau of Economic Research, working paper, No. 28005, revised May 2021. Crossref
Karger, Ezra, and Aastha Rajan, 2021, “Heterogeneity in the marginal propensity to consume: Evidence from Covid-19 stimulus payments,” Federal Reserve Bank of Chicago, working paper, No. 2020-15, revised February 21, 2021. Crossref
Summers, Lawrence H., 2021a, “My column on the stimulus sparked a lot of questions. Here are my answers.,” Opinions, Washington Post, February 7, available online.
Summers, Lawrence H., 2021b, “The Biden stimulus is admirably ambitious. But it brings some big risks, too.,” Opinions, Washington Post, February 4, available online.
Yellen, Janet L., 2015, “Inflation dynamics and monetary policy,” speech by the Board of Governors of the Federal Reserve System Chair at the Philip Gamble Memorial Lecture, University of Massachusetts Amherst, September 24, available online.


