

The following publication has been lightly reedited for spelling, grammar, and style to provide better searchability and an improved reading experience. No substantive changes impacting the data, analysis, or conclusions have been made. A PDF of the originally published version is available here.
The savings and loan debacle has important repercussions for many parties. Among these is the savings and loan association (S&L) industry itself, which is shrinking rapidly as a major financial player. For most of the post-World War II period, savings and loans were the great success story among financial institutions in the U.S. The assets of the industry grew rapidly, not only in absolute dollar terms, but also relative to most other major types of financial institutions. The market share of S&L assets increased steadily from 6% of the assets of 11 major types of financial institutions in 1950, to 12% in 1960, to 14% in 1970, and to 15% in 1980 (see table 1). In contrast, the market share of commercial bank assets declined from 52% in 1950 to 37% in 1980, of life insurance companies from 22% to 12%, and of mutual savings banks from 8% to 4%. Only pension funds among the larger types of institutions had increased their market share more rapidly in this period. S&Ls grew from the fourth largest type of institution in 1950 to the second largest in 1980, behind only commercial banks.
1. Market share changes for financial intermediaries
| % of total intermediary assetsa | ||||||
|---|---|---|---|---|---|---|
| Intermediary | Assets 1990a (billions of dollars) |
1950 | 1960 | 1970 | 1980 | 1990 |
| Commercial banks | 3,279 | 52 | 38 | 38 | 37 | 32 |
| Life insurance companies | 1,378 | 22 | 20 | 15 | 12 | 13 |
| Private pension funds | 1,194 | 2 | 6 | 9 | 12 | 12 |
| S&Ls | 1,159 | 6 | 12 | 14 | 15 | 11 |
| State & local pension funds | 753 | 2 | 3 | 5 | 5 | 7 |
| Mutual funds | 588 | 1 | 3 | 4 | 2 | 6 |
| Finance companies | 539 | 3 | 5 | 5 | 5 | 5 |
| Casualty insurance companies | 507 | 4 | 5 | 4 | 4 | 5 |
| Money market funds | 453 | - | - | - | 2 | 4 |
| Mutual savings banks | 284 | 8 | 7 | 6 | 4 | 3 |
| Credit unions | 213 | - | 1 | 1 | 2 | 2 |
| Total | 10,347 | 100 | 100 | 100 | 100 | 100 |
aSecond quarter for 1990. Fourth quarter for all other years.
Shrinking shares and numbers for S&Ls…
S&Ls maintained their market shares through most of the 1980s despite a precarious financial situation. Primarily as a result of losses from lending long and borrowing short when interest rates soared in the late 1970s and early 1980s, about 85% of all S&Ls lost money in 1982, and when measuring their assets and liabilities on a market-value basis, some two-thirds of the associations were insolvent. Although interest rates declined sharply in the mid-1980s, many S&Ls continued to lose money because of bad loans, excessive operating costs, including very high rates on deposits, and fraud. Furthermore, S&Ls incurred a sharp increase in deposit insurance premiums—from .08% to .21%—which also increased operating costs significantly. Nevertheless, through 1988 they increased their market share relative to commercial banks and to life insurance companies, which were the third largest type of financial institution.
This scenario changed abruptly after 1988. First, regulators adopted a tougher attitude, particularly with respect to permitting insolvent associations to remain in operation and to expand rapidly. Second, in 1989 Congress enacted the Financial Institutions Reform, Recovery and Enforcement Act (FIRREA). The act accelerated the resolution of insolvent associations by providing greatly increased funds to the FDIC, so that it could make up the shortfall between the value of the institutions’ assets and the guaranteed par value of their deposits. The resolution of these insolvent associations resulted in lower deposit growth, as the excessive interest paid by many of the associations to attract funds quickly was reduced. In addition, the act required higher capital-to-asset ratios at the remaining institutions.1 This also slowed deposit growth because most associations chose to increase their capital ratios by reducing deposits rather than by increasing capital. More recently, a significant percentage of the deposits at insolvent associations closed by the Resolution Trust Corporation (RTC) was purchased by commercial banks and left the S&L industry.
As a result, S&L market share of financial institutions slid from a peak of 16% in 1984 to 15% by year-end 1988 and then more rapidly to only 11% by midyear 1990. This wiped out the gains of 30 years of growth. It is not unreasonable to project that by year-end 1990, the market share of S&Ls will not be greatly different from what it was 35 years earlier in the mid-1950s, when the associations began their rapid growth.
Along with declines in market share, the industry has also seen the number of associations decline. At year-end 1989, there were near 2,900 S&Ls in operation, and by year-end 1990, the number of associations may be below 2,500.2 This number would be nearly one-half the number of associations in 1980 and only about one-third the number in 1960, when nearly 6,500 S&Ls were in operation. Of course, during most of the period of decreases in the number of associations, total S&L assets were increasing rapidly, so that through 1988 the remaining associations were larger, on average. But since 1988 total assets have declined faster than the total number of associations, as proportionately more larger associations have become insolvent and resolved. As a result, the average asset size of the remaining associations has begun to decline.
…But not shrinking services for customers
The shrinking of the S&L industry does not necessarily imply an equal shrinking of the services it traditionally provided, namely, residential mortgage lending and savings deposit gathering.
In fact, S&Ls have been reducing their share of the residential mortgage market for some time with little discernible negative effect on mortgage borrowers. In midyear 1990, S&Ls held 27% of all mortgages.3 As can be seen from table 2, this represents a decline of 40% from the 45% market share in 1980 and is the lowest percentage penetration since the 1940s.
2. Residential mortgages
| 1950 | 1960 | 1970 | 1980 | 1990c | |
|---|---|---|---|---|---|
| Total residential mortgages (billions of dollars) | |||||
| 45 | 142 | 298 | 978 | 2,493 | |
| % Distribution | |||||
| S&Lsa | 29 | 39 | 41 | 45 | 27 |
| Commercial banks | 21 | 14 | 14 | 17 | 16 |
| Mutual savings banks | 10 | 15 | 14 | 7 | 5 |
| Life insurance companies | 19 | 18 | 9 | 2 | 1 |
| Households | 17 | 7 | 8 | 6 | 6 |
| Government | 3 | 5 | 7 | 8 | 6 |
| Mortgage poolsb | - | - | 1 | 9 | 31 |
| Other | 1 | 2 | 6 | 6 | 8 |
| Total | 100 | 100 | 100 | 100 | 100 |
a Includes mortgage pools.
b Excludes savings and loan associations.
c Midyear.
This decrease in mortgage activity reflects three developments in the industry. First, S&Ls shifted into other kinds of lending, such as consumer loans and commercial mortgages, in response to the new powers granted them by deregulation in the early 1980s. Second, as noted earlier, the growth in their overall asset base slowed and then turned negative. Third, residential mortgage lending became more attractive to commercial banks and life insurance companies with the advent of mortgage-backed securities, which, unlike whole mortgages, are marketable.
It is difficult to identify precisely the institutions that took up the slack in mortgage investment from the available data, because the ownership of mortgages that are pooled and securitized cannot be broken out for investors other than S&Ls. Such mortgage-backed securities have grown rapidly in recent years and now account for more than one-third of all residential mortgages outstanding.
At the same time that S&Ls have decreased their residential mortgage activity, they have been facing new competition for savings deposits, largely from money market funds. Thus, the diminished role of S&Ls is likely to result primarily in a reshuffling of their activities to other types of institutions. This is not to say that there may not be some disruptions and additional search required by traditional S&L customers during the transition period, but other sources of these services will be out there.
What will S&Ls do in the future?
In the longer run, the financial services industry may very well resemble the grocery industry: firms of every conceivable size and shape would cater to every conceivable taste on a voluntary basis, with no product or geographic regulation other than that of the marketplace. Survival and success will belong to the best-managed institutions in each niche. Thus, the surviving S&Ls must become sufficiently expert in some activities to fend off competition from a wide variety of other types of institutions. It is likely, however, that many of the S&L survivors will remain primarily residential mortgage lenders, an area in which they have long experience.
At the same time that the S&L industry is undergoing this transition, the entire depository institutions subsector of the financial services industry may be expected to grow more slowly or even to contract in the near future as a result of three forces:
- Steeply higher premiums for federal deposit insurance. These premiums are equivalent to a tax on these institutions that is not levied on their competitors.4 In part, this may be viewed as reducing or even reversing any implicit subsidies from underpricing deposit insurance in the past, particularly for poorly capitalized or insolvent institutions, which had encouraged rapid growth. Higher premiums are particularly important in light of a perceived implicit expansion of the federal safety net to some important quasi-government competitors, such as the Federal Home Loan Mortgage Corporation (Freddie Mac) and the Federal National Mortgage Corporation (Fannie Mae), without charging insurance premiums.5 This lowers the cost of funds to these institutions and permits them to bid higher for investments and accept a lower interest rate, putting depository institutions at a competitive disadvantage.
- Higher equity capital requirements. These requirements are costly to meet because, unlike interest payments on deposits, dividend payments on equity are not deductible from taxable income.
- Technological innovations in computerization and telecommunications. These reduce the comparative advantage of depository institutions in gathering and analyzing credit information as well as transferring funds from investors to borrowers. For example, technology makes it possible to track and monitor the hundreds of individual loans that make up a securitized pool. In addition, technology makes it easier for prime corporate borrowers to issue commercial paper directly to investors instead of obtaining bank loans, particularly if the bank has suffered during the industry’s recent financial difficulties and so has a lower credit rating than the ultimate borrower. Thus, the cost structure of financial intermediation by traditional depository institutions may be too high to make them economically viable without a reduction in the resulting overcapacity.
In sum, S&Ls are being hit from two sides. Shrinkage from financial difficulties is occurring simultaneously with shrinkage of all depository institutions from technological and regulatory change. It is unlikely the S&Ls will again achieve the relative importance they had in recent decades.
MMI—Midwest Manufacturing Index
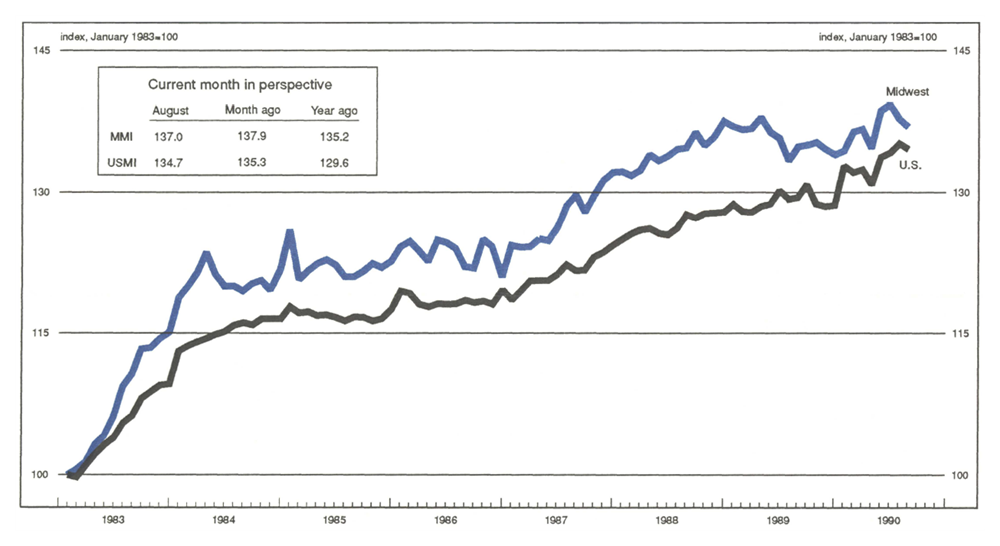
In August, manufacturing activity in the Midwest declined 0.6%, marking the second monthly decline after the peak for the current expansion in June. While over half of the 17 industries in the MMI recorded declines in August, two key industries showed improvement—machinery and metalworking.
Over the last three months, strength in Midwest manufacturing activity has centered on the metalworking and transportation industries. Nationally, the Federal Reserve Board’s Index of Industrial Production has been buoyed by a relatively strong durable goods manufacturing sector, also led by the metalworking- and transportation-related industries. However, planned auto production for the fourth quarter indicates softening in the transportation industry in the months ahead.
Notes
1 A more detailed description of the provisions of FIRREA appears in Elijah Brewer, “Full-blown crisis, half-measure cure,” Economic Perspectives, November/December 1989, pp. 2-17.
2 The precise number of S&Ls currently in operation is difficult to identify, as a large number of insolvent associations are operated in conservatorship or receivership by the RTC awaiting final disposition by sale, merger, or liquidation. For example, at year-end 1989, 281 associations with assets of $128 billion were under the supervision of the RTC. Six months later, on June 30, 1990, the number was 247 associations with $141 billion of assets. This represented about 9% of all associations and 11% of all assets. During these six months, 170 associations were sold, merged, or liquidated and 136 other insolvent associations were transferred to the RTC.
3 S&Ls originated a larger percentage of new mortgages but sold them to other investors.
4 On January 1, 1990, premiums were increased from .21% to .23% for S&Ls and from .08% to .12% for commercial banks. Premiums are scheduled to increase again for commercial banks on January 1, 1991, to at least .195% and possibly higher for all institutions.
5 A description of these agencies and their government support appears in United States General Accounting Office, Government-Sponsored Enterprises: The Government’s Exposure to Risks, Washington, D.C., August 1990.


