

The following publication has been lightly reedited for spelling, grammar, and style to provide better searchability and an improved reading experience. No substantive changes impacting the data, analysis, or conclusions have been made. A PDF of the originally published version is available here.
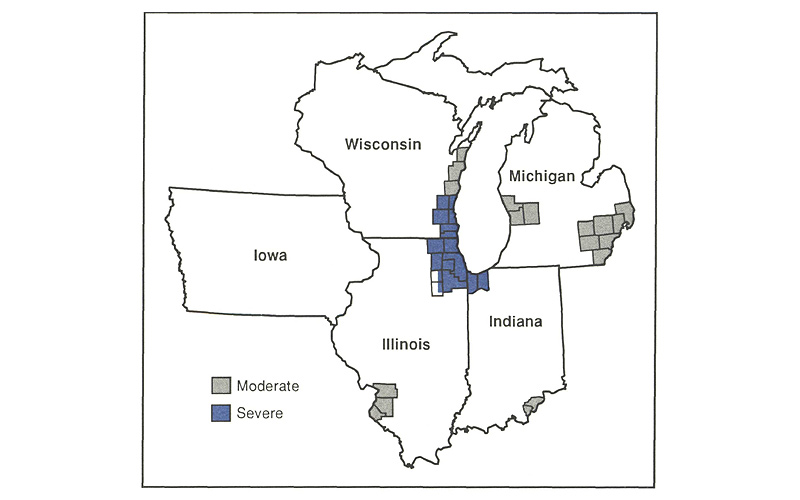
The 1990 Amendments to the federal Clean Air Act require that metropolitan areas exceeding allowed levels of ozone must take corrective action to come into compliance. In the Midwest, the Chicago, Milwaukee, and northwest Indiana areas have been designated among the nation’s worst offenders, rating a “severe” classification. The Chicago area, for example, must reduce its ozone-causing emissions by 15% before 1996 and make further reductions of 3% per year through the year 2007. Other Midwest areas with “moderate” cleanup problems include Detroit, Lansing, and Muskegon, Michigan; Sheboygan, Wisconsin; and East St. Louis, Illinois (see figure 1).1
1. Seventh District ozone nonattainment areas
The 1990 Amendments specify a variety of actions that all nonattainment areas must take toward compliance. Additionally, by November 1994, states with nonattainment areas must design their own plans for achieving further ozone reductions, if necessary, to come into compliance. In developing these plans, states have considerable latitude to decide which sources and activities to control.
By the year 2010, all urban areas in the country must meet air quality standards as set by the U.S. Environmental Protection Agency. Because compliance can be costly, the task of meeting these standards may significantly affect the economic well-being of an urban area or region. This Fed Letter outlines the compliance choices facing the Midwest as it embarks on this task.
The ozone problem
Urban ozone, an important ingredient in smog, is created by a photochemical reaction in the lower atmosphere involving nitrogen oxide (NOx) and volatile organic compounds (VOCs). Most NOx is the product of burning fossil fuels (coal, oil, or gas)—a process that occurs regularly in electric utilities, industrial furnaces, and automobiles. VOCs are produced by auto emissions, vapors released during auto refueling, paints, thinners, and cleaning solvents. When heat and sunlight are present, the combination of NOx and VOCs produces ozone. Ozone is the most ubiquitous air pollutant, plaguing scores of urban areas throughout the world. Among other effects, high levels of ozone are known to impair breathing and to reduce the yields of several major cash crops.
The federal government first addressed the problem of urban air pollution in 1970 with passage of the Clean Air Act (CAA). Since that time, the nation has made great strides in air improvement. Of the six common air pollutants regulated by the CAA (sulfur dioxide, nitrogen oxides, carbon monoxide, particulates, lead, and ozone), only ozone remains a problem shared by most urban areas.
Congress referred to the health effects of air pollution in explaining the rationale behind the CAA. That law mandates a standard of air quality that would provide a margin of safety for the most health-sensitive individuals. Some argue that such a standard is too stringent. Expenditures for environmental cleanup may be wasteful if the costs of abatement are greater than the benefits produced. Once some level of air purity has been attained, it may be more economical to pursue alternatives to additional pollution abatement, such as public health programs.
Regardless of the continuing debate over air quality standards, Chicago and other metropolitan areas must now address three basic questions regarding ozone control. The first is whether to comply with the law’s stringent deadlines and standards. Second, once areas decide to comply, they must make tough and highly risky choices as to which type of emission to control—NOx or VOCs—and which firms and activities to target in order to achieve the required emission reductions. Finally, policymakers must decide how to control emissions, whether by applying tried-and-true technology requirements to all industrial processes, or by trying innovative programs involving market-based methods such as emission allowance trading.
Whether to obey
In 1970 and 1977, the federal government passed laws establishing clean air standards and controls for the nation. Yet noncompliance has been widespread, and target air standards have not been met. The 1990 Amendments to the CAA set stringent timetables for reducing ozone’s precursors, NOx and VOCs, and this time, the legislation is designed to ensure greater compliance. Compared with earlier laws, the federal government has now been given significantly more power to issue sanctions, impose penalties, and preempt state implementation plans if they prove inadequate.
An additional aid to compliance is the Intermodal Surface Transportation Efficiency Act of 1991. This Act sets aside $155 billion for states to use over the next six years to develop or improve any forms of surface transportation systems, including air-friendly mass transit systems. Of that amount, $6 billion is earmarked for nonattainment areas to use in planning congestion mitigation and air quality improvement.
Which sources to target
The 1990 Amendments specify a variety of technologies and processes that emission sources must adopt in order to reduce emissions of NOx and VOCs. In “severe” nonattainment areas like metropolitan Chicago, sources emitting as few as 25 tons of NOx and VOCs per year will now be regulated; previously, only sources of 100 tons or more were targeted. Businesses such as commercial dry cleaners, large house-painting companies, and some auto body shops will thus be included and will face the complex maze of environmental regulations for the first time.
Federally required technology controls, along with mandated measures on mobile sources such as automotive fuels and tailpipe standards, will presumably reduce urban ozone over time. As metropolitan areas continue to grow, these remedies alone will probably not reduce emissions enough to achieve target air quality standards in many urban areas. That is why the 1990 Amendments require states with nonattainment areas to develop their own plans for achieving additional reductions. The rationale is that a customized plan can best address local conditions such as industry composition and expected growth rates.
To produce these plans, states must make their own decisions about which sources and activities to control. One recent study indicates that the choices can carry widely differing price tags.2 For instance, controlling VOCs would cost $3,600 per ton emitted at small dry cleaners, but only $230 per ton at large dry cleaners. By comparison, the technology that has been mandated for vapor recovery at auto gas pumps will cost an estimated $1,000 per ton of VOCs. In targeting sources, states will naturally want to choose those where abatement costs are lowest, or marketplace pressures are least intense.
A related set of issues stems from the complexity of atmospheric transport and chemistry. An urban area’s ozone problem is affected by the geographic distribution of facilities. High NOx emission in a remote location, for example, may contribute little to the area’s problem. Sources upwind from a city may cause more urban ozone than downwind sources. To plan effectively for air quality, we need to learn more about the role of these factors, for example, by using atmospheric models of the urban air shed. The states surrounding Lake Michigan have formed a consortium to produce such a model, and the results are to be made available in the near future.
How to comply—flexibility preferred?
High environmental standards form the underpinning for the CAA and the 1990 Amendments. Given the magnitude of the mandated task, state and regional policymakers will need all possible flexibility. One of the criticisms of national pollution control policy in the past was that it imposed the same regulatory conditions on areas with varying industrial conditions and hence different costs of complying. The 1990 Amendments responded to this criticism by allowing some flexibility. Presumably, if allowed to choose among a variety of methods for achieving a given environmental goal, areas will pursue the least burdensome and most promising ones.
Examples of the resulting creativity are proposals now being considered by the Illinois Environmental Protection Agency. Under these proposals, firms would be given tradable NOx emission allowances, any part of which they could buy or sell to other firms. Variations of this approach include letting firms “bank” emission allowances or lease them to other firms and allowing interstate as well as interurban tradability.
Such proposals may sound like attempts to create loopholes or to legitimize “rights to pollute,” but in fact they do not imply any lowering of environmental standards. Rather, a given level of air quality can often be achieved at lower cost through flexible plans than through fixed, across-the-board regulations. Nevertheless, large-scale ozone allowance schemes remain unproven. Administrative and enforcement costs might exceed the possible gains achieved by flexibility, especially for small businesses whose record-keeping costs might be large in relation to potential benefits.
Despite the flexibility of the 1990 Amendments, some wonder whether they grant enough local discretion. In Chicago and other areas, for instance, ozone excesses typically occur in spells of one to three days during the late spring or summer. Yet the law still does not allow temporal controls that would prohibit emission activities only during ozone-sensitive days. Such schemes have not yet been fully studied, but they seem very likely to yield considerable savings in cost.
Mobile source options
Air quality improvements of the past have largely been achieved through technological solutions imposed nationally. This is especially true for transportation emission sources. For example, as a result of federally imposed mileage requirements on auto fleets and technology such as catalytic converters to reduce emissions per gallon, autos have become much more fuel-efficient (as much as 80% since 1970). Similarly, most vehicles now on the highway run on lead-free gasoline.
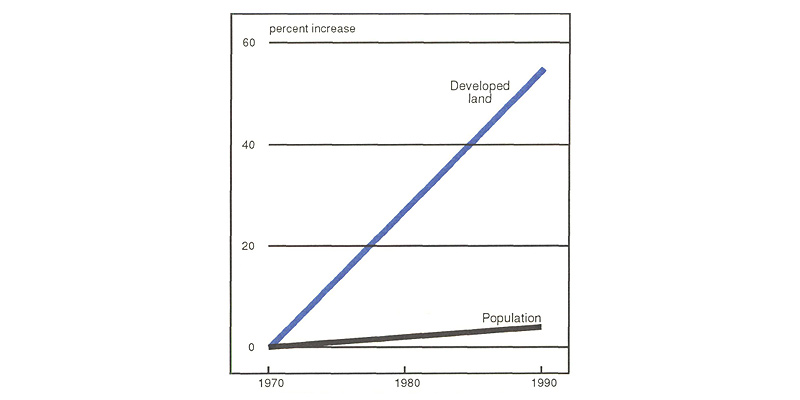
But while public policy has imposed technological demands on automakers, it has largely ignored the actual behaviors of individuals, local governments, and firms. These behaviors underlie an important recent phenomenon: the steady increase in the number of vehicle miles traveled (VMT). This increase is the result of development trends such as Chicago’s, where population has grown by only 4% since 1970, while developed land has grown by 55% (see figure 2). Because of VMT increase, mobile sources now contribute between one-third and one-half of the precursor emissions on days when ozone standards are exceeded. Indeed, the rise in VMT has offset the air quality gains achieved by cleaner-burning vehicles. Facts such as these suggest that solving the ozone problem will require looking beyond technological fixes.
2. Chicago area development trends
Accordingly, it is not surprising that the 1990 Amendments contain many provisions, both mandatory and flexible, for mobile sources. One example is the requirement that by 1994, all employers in “severe” nonattainment areas must submit plans by which their employees will increase the average passenger occupancy per vehicle (AVO) in commuting trips between home and work by 25% above the current local average. At first glance, this requirement seems squarely in the tradition of explicitly detailed mandates. Yet flexible compliance may be feasible. For instance, in a proposal now being considered by the State of Illinois, employers that could achieve increases in AVO above the required level could “sell” the excess in a local market. Other employers would “purchase” the excess (and thus be allowed to fall short of their required AVO increase) if that cost less than compensating employees for changing their commuting behavior. Such plans allow an area to reach its clean air standards through the efforts of employers to whom it costs least.
Other flexible programs allow choosing between mobile sources such as automobiles and stationary sources such as factories in order to reduce emissions. Unocal Co. of California reportedly spent $5 million in Los Angeles to purchase 8,376 old autos (“clunkers”), scrap them, and thereby eliminate 13 million pounds of VOC and NOx emissions annually. It would have cost the company an estimated $150 million to realize the same reduction at its refinery. Illinois has conducted a pilot study to explore a similar program.
Conclusion
The question of whether to comply with ozone regulations has been largely foreclosed; states and companies now face stiff penalties and foregone rewards if they do not comply. At the same time, states and cities now have greater latitude to chart their own course for achieving mandated clean air standards. This latitude does not imply a lessening of responsibility. Rather, it requires local policymakers to gather much information, develop many ideas, and build the consensus they will need in order to implement cost-effective environmental controls.3
Tracking Midwest manufacturing activity
Manufacturing output index (1987=100)
| April | Month ago | Year ago | |
|---|---|---|---|
| MMI | 119.8 | 119.0 | 111.0 |
| IP | 111.0 | 110.7 | 106.7 |
Motor vehicle production (millions, saar)
| May | Month ago | Year ago | |
|---|---|---|---|
| Autos | 6.0 | 6.3 | 6.1 |
| Light trucks | 4.3 | 4.6 | 3.8 |
Purchasing Managers’ Surveys: production index
| May | Month ago | Year ago | |
|---|---|---|---|
| MW | 59.7 | 61.5 | 60.4 |
| U.S. | 55.8 | 51.8 | 62.9 |
Purchasing Managers’ Surveys (production index)
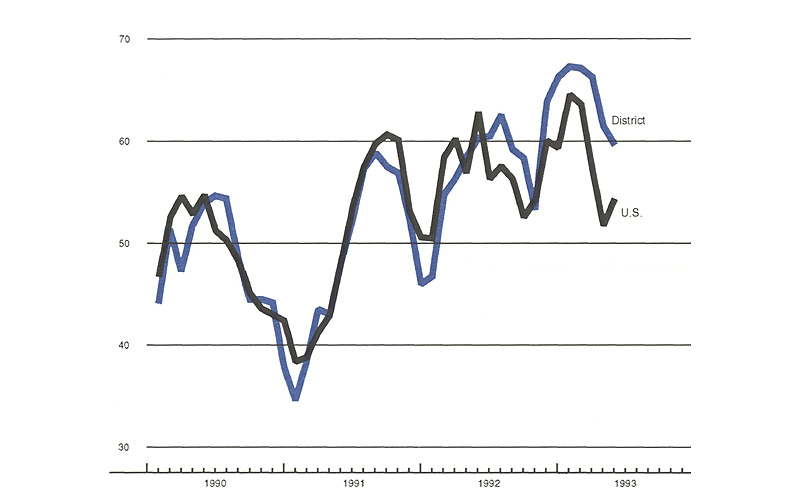
Surveys of purchasing managers suggest that industrial output growth eased in the Midwest in April and May. This small loss of momentum followed a slowdown in consumer spending growth in the weather-depressed first quarter. At the same time, heightened political uncertainty may have led survey respondents to make gloomier assessments than they would have otherwise.
More recently, automakers have responded to strengthening in consumer demand with significantly increased production plans for the third quarter. The outlook for the motor vehicle sector, new improvement in some other industries that have been weak for some time (notably construction and agricultural machinery), and a modest revival in consumer spending all point to increased industrial output in the Midwest in the months ahead.
Notes
1 There are five primary categories of ozone nonattainment. The 1990 Amendments to the Clean Air Act require areas with the most ozone pollution to adopt more stringent controls, albeit over longer allowable periods of time. The Los Angeles area is the only one in the worst category, “extreme.” The remaining categories are “severe,” “serious,” “moderate,” and “marginal.” No areas within the boundaries of the illustrated map are classified “serious.” On that map, “marginal” areas are intentionally not indicated.
2 A.J. Krupnick and R.J. Kopp, The Health and Agricultural Benefits of Reductions in Ambient Ozone in the United States, Resources for the Future, Washington, D.C., 1988.
3 As a contribution to the region’s tasks of gathering information and building consensus, the Federal Reserve Bank of Chicago held a conference in June 1993 that brought together the nation’s authorities on ozone production and control, along with policymakers, public officials, health scientists, and business representatives. The conference focused on cost-effective means for urban areas to comply with CAA ozone requirements. Discussions also addressed the costs of ozone abatement such as job losses, as well as the benefits to human health.


