

The following publication has been lightly reedited for spelling, grammar, and style to provide better searchability and an improved reading experience. No substantive changes impacting the data, analysis, or conclusions have been made. A PDF of the originally published version is available here.
Economic growth accelerated as 1993 came to a close, cementing consumer and business confidence in further expansion. In an increasingly upbeat environment, 44 business economists and analysts from around the Midwest met in December to discuss prospects for growth in 1994 at the Federal Reserve Bank of Chicago's seventh annual Economic Outlook Symposium. The consensus forecast produced by participants at the meeting called for steady growth to continue in 1994 along the same lines as in 1993, with little or no increase in inflation and only a modest increase in interest rates.
This Fed Letter reviews the consensus forecast and related presentations from the December meeting, focusing on trends in cyclically sensitive industries important to the Midwest economy.
Putting the 1994 outlook in perspective
The forecast for 1993 was prepared amid considerable uncertainty, due in part to the fact that alternative labor market indicators were pointing in nearly opposite directions. Despite this ambiguity, the consensus forecast of 2.8% growth in real gross domestic product (GDP) during 1993 proved close to the mark, with relative strength appearing in the same areas as forecast.
Some of the deviations from forecast for the individual components of GDP illustrate how growth proceeded last year. After their annual benchmark revision, payroll data showed that employment was recovering considerably faster than depicted at the time of last year's forecast. Consumer spending growth in 1993 materialized somewhat more slowly than forecast, perhaps because improvement in consumer attitudes or balance sheet adjustment proved to be a greater hurdle than expected. Residential investment outpaced overall economic growth in 1993 but increased more slowly than forecast. On the other hand, business fixed investment grew considerably faster than expected, helping to boost overall real GDP growth to the forecasted rate.
Economic growth gained momentum in the latter half of 1993, and the atmosphere at the 1994 forecast meeting was relatively upbeat. A number of reports released just prior to the meeting showed strength in motor vehicle sales and production, housing activity, consumer and business sentiment, and retail business in the early stages of the holiday shopping season. Still, the consensus forecast for real GDP growth in 1994 is 2.9%, only modestly above the estimated rate for 1993 (see figure 1). Personal spending is expected to continue growing, but at a modestly slower pace than in 1993. Likewise, growth in business fixed investment and residential construction are both expected to fall back modestly from their respective 1993 rates but are still anticipated to increase faster than overall GDP. Further improvement in the unemployment rate is expected. At the same time, little or no change is expected in the rate of inflation as measured by the change in the Consumer Price Index (CPI), and the prime rate is expected to increase only modestly.
1. Selected economic indicators and 1994 forecast
| 1990 | 1991 | 1992 | 1993a | 1994b | |
|---|---|---|---|---|---|
| Real GDP growth (%) | 1.2 | –0.7 | 2.6 | 2.8 | 2.9 |
| Personal spending | 1.5 | –0.4 | 2.6 | 3.2 | 2.9 |
| Business fixed investment | 1.2 | –5.9 | 2.9 | 10.9 | 8.9 |
| Car and light truck sales (millions) | 13.9 | 12.3 | 12.8 | 13.8 | 14.8 |
| Housing starts (millions) | 1.20 | 1.01 | 1.21 | 1.26 | 1.40 |
| Unemployment rate (%) | 5.5 | 6.8 | 7.4 | 6.8 | 6.5 |
| Inflation rate-CPI (%) | 5.4 | 4.2 | 3.0 | 3.0 | 3.0 |
| Prime rate (%) | 10.0 | 8.5 | 6.3 | 6.0 | 6.1 |
b Forecast.
Overall, this year's forecast points to slow but consistent growth in 1994, with above-average gains in areas in which Midwest productive capacity is concentrated.
“The motor vehicle industry is alive and well”
Motor vehicle sales and production are expected to improve further in 1994. Car and light truck sales strengthened markedly in late 1993, rising to a seasonally adjusted annual rate of 14.2 million units in December, the highest rate for that month since 1988 (see figure 2). For 1993 as a whole, sales were nearly 10% higher than in 1992. Domestically based automakers were cutting back on bulk sales to rental fleets during the year, and underlying consumer demand strengthened more than the increase in the unit sales data indicated.
2. Car and light truck sales (including imports)
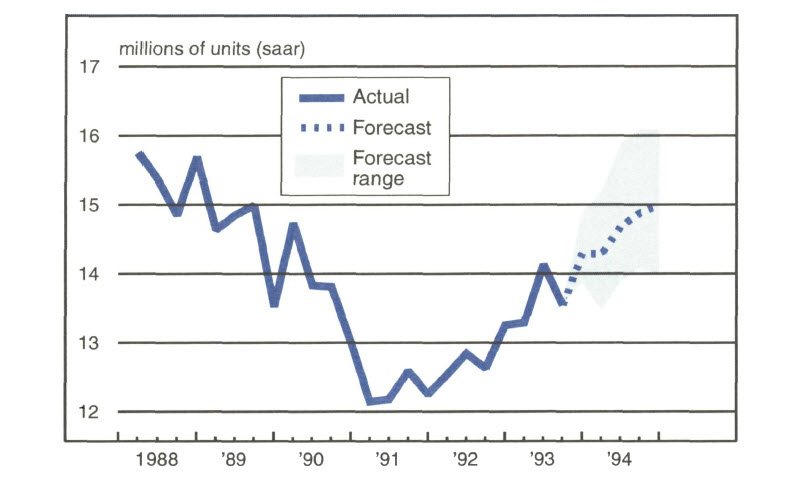
Several factors contributed to the turnaround in 1992 and 1993 and the continuing recovery anticipated in 1994. The real price of new cars has been appreciating more slowly in recent years, while prices for used vehicles have strengthened considerably. The increasing relative price of used cars should combine with an aging fleet to continue boosting the trade-in market in 1994. Auto loans outstanding declined relative to disposable personal income over the last four years, and affordability benefited from the decline in interest rates during this period. Consumers are increasingly willing to utilize new credit, a trend reflecting improved consumer confidence. The consensus forecast called for light vehicle sales to rise to 14.8 million units in 1994, up from an estimated 13.8 million vehicles in 1993.
A great deal of ferment underlies the picture of gradually improving conditions in the overall market. The auto supplier base is likely to continue consolidating, in part because of the increased risk associated with investing in productive capacity. Technological change in production is accelerating, and suppliers often need to invest in new productive capacity for products with shorter product life cycles and less certainty of success. At the same time, automakers' standards for quality and price have become more exacting. While consolidation is expected to continue, the remaining supplier base should benefit as transplant assembly operations step up their purchase of parts produced in the United States.
The National Automobile Dealers Association provided a valuable perspective on trends facing the auto industry's closest representative to the consumer. Confidence among auto dealers was running high as 1993 came to a close. Used vehicle sales and servicing revenues helped bolster dealers' profitability during the slowdown in the market that began in 1989, while declining interest rates reduced floor plan costs. With recovery in 1992 and 1993, dealership profitability improved significantly, and cash flow from new vehicle sales turned positive after forming a drag on results from 1989 to 1991. The industry still faces a challenge to keep monthly payments at a constant share of family income while real prices of new cars continue to appreciate, however. A number of participants at the meeting cited the increasing use of leasing as a way of improving affordability, but this avenue could offer only limited relief.
Several analysts pointed out other financial factors that had helped promote recovery in the auto industry. As interest rates fell in recent years, the cost of financing dealer inventories also declined, prompting greater inventory investment (and higher sales) than otherwise would have occurred. Lower interest rates also heightened lenders' willingness to extend credit to consumers. As loan-loss experience worsened in the developing recession, lenders scrutinized dealer appraisals of consumer credit quality more closely. Many lenders began forcing dealers to share the costs of previous loan losses.
Declining risk-free interest rates played an important role in supporting the willingness to engage in new credit sales during this period. In addition, as the spread between risky and risk-free interest rates widened, the opportunity cost of investing in risk-free assets rose while the potential profitability of lending increased, prompting greater credit supply. Lower interest rates also helped lower the cost to consumers of an expensive asset financed over an uncertain future.
Light vehicle sales in 1994 will clearly depend on the path of interest rates as the year progresses. If the consensus outlook for a modest increase in borrowing rates proves accurate, sales should continue to benefit.
Capital spending—a bright spot again
Capital spending gains injected vital fuel into the Midwest economy in recent years, with investment in motor vehicles (and in the motor vehicle industry itself) playing an important role. Investment spending can be subject to substantial cyclical swings, and one of the most volatile areas in recent years has been the heavy-duty truck market. Orders and output in this market dropped by nearly half between 1989 and 1991. Since then, however, the industry has witnessed what one analyst described as a production and demand explosion. Industry output reached its highest level in over a decade during 1993, and backlogs ended the year at a 15-year high. After two years of growth in excess of 30%, one industry analyst expects North American production to grow much more slowly in 1994—perhaps as little as 5%—primarily because output is running so close to capacity.
The same analyst expected overall investment spending growth to continue benefiting from the developing consensus that improving productivity and profitability requires increasing capital-labor ratios. This trend has been driven in part by technological advances, lower interest rates, and rising health care costs. For the economy as a whole, however, shifting to higher capital-labor ratios can entail some difficult short-run costs. The economy seems to have undergone more intense “creative destruction” in recent years than a recession and recovery might have dictated in the past, which partly explains the halting nature of the early stages of the recovery.
Even as the drive for productivity accelerated, however, corporate profitability improved relatively slowly over the past two years. Compared with past recoveries, margin expansion played a lesser role and sales increases a greater role in generating earnings gains. As economic expansion matures, however, there should be greater improvement in profitability, with firms reaping the rewards of investment in new, increasingly flexible and productive forms of capital.
Small firm optimism surges entering the new year
A variety of error sources can undermine macroeconomic statistics, particularly those formulated with a premium on timeliness. Error is especially a risk when sampling and estimation techniques inadequately capture trends among small firms.
Sometimes, private data sources can help meet the public need for good information. One example is a monthly survey by the National Federation of Independent Business (NFIB), which tracks owner-managed firms on a variety of dimensions including sales, hiring, capital spending, and financial conditions. The November survey showed substantial brightening in small firms' appraisals of future business conditions, after attitudes had deteriorated following a post-election euphoria early in 1993. The survey's overall “small business optimism” index rose sharply in November, recovering nearly all the ground lost earlier in the year. This could represent a forecast by small firms of better times ahead.
Anticipatory hiring and spending normally produces a growth spurt in the early stages of a recovery, but the NFIB survey results seemed to show that faith in future expansion was missing during 1992 and much of 1993. Hiring plans among the NFIB membership jumped to pre-recession levels in late 1993, however, and the percentage of firms stating that their inventories were too low reached the highest level in the 20-year history of the survey. Small firm borrowing demand remained relatively dormant during most of the past two years, but it seems likely that the tide is turning, pointing to increased demand in 1994.
“Until now,” the NFIB president noted at the December meeting, “the recovery has been missing a willingness to bet on the future…. Now, attitudes have taken on a new character.” Amid all the signs of new improvement in hiring plans, capital spending plans, and the need for inventory replenishment, the percentage of firms reporting increased prices reached a record low.
Is the outlook too much of a good thing?
Could the optimistic outlook contain the seeds of its own demise? Perhaps the clearest and most hotly debated risk discussed at the December meeting was the possibility that rising inflationary expectations and interest rates might choke off the pace of expansion.
Many commodity prices were climbing as 1993 came to a close, and one economist at the meeting stated that signs of speculative excess in financial markets were beginning to emerge, and with them, a greater need for monetary policy restraint. This observation sparked a spirited discussion of the forces operating on both sides of the inflation coin. Several participants noted that falling oil prices, weak overseas economies, and increased productivity in the domestic economy were dampening the inflation threat. Not everyone agreed, but these latter ideas seemed to underlie the consensus forecast for moderate economic growth with little change in inflation and only a negligible increase in prime borrowing rates.
Tracking Midwest manufacturing activity
Manufacturing output index (1987=100)
| November | Month ago | Year ago | |
|---|---|---|---|
| MMI | 124.5 | 122.1 | 114.8 |
| IP | 114.4 | 113.4 | 108.9 |
Motor vehicle production (millions, saar)
| December | Month ago | Year ago | |
|---|---|---|---|
| Cars | 6.8 | 6.6 | 6.1 |
| Light trucks | 5.8 | 5.2 | 4.8 |
Purchasing Managers’ Surveys: production index
| December | Month ago | Year ago | |
|---|---|---|---|
| MW | 66.2 | 65.4 | 66.2 |
| U.S. | 64.4 | 59.3 | 59.4 |
Manufacturing output index, 1987=100
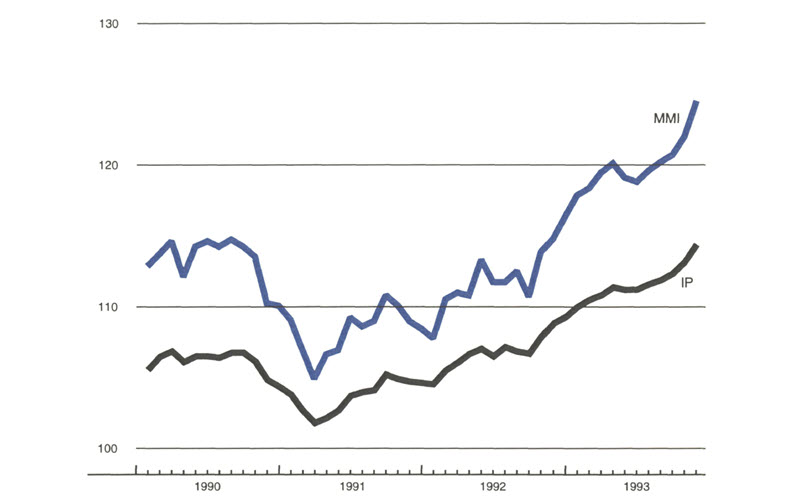
Expansion in Midwest manufacturing activity gained greater momentum during the fourth quarter. The Midwest Manufacturing Index (MMI) rose sharply from September through November, with output in the region growing faster than the national average. The auto industry accounted for a large share of the recent gains, both regionally and nationally. At the same time, expansion occurred in a wider range of industries than in previous months.
Purchasing managers' surveys and motor vehicle production data suggest that Midwest manufacturing activity continued to expand at a relatively robust pace through December. The composite production index for the District purchasing managers' surveys indicated stronger output growth than the national average for the fourteenth consecutive month.


