

The following publication has been lightly reedited for spelling, grammar, and style to provide better searchability and an improved reading experience. No substantive changes impacting the data, analysis, or conclusions have been made. A PDF of the originally published version is available here.
Economists have consistently argued that durable goods are among the primary drivers of economic activity. The cyclical tendencies of this sector make durable goods key indicators of cyclical turning points and trends in the overall economy. No industry better exemplifies this than the auto industry. In the Midwest, the auto sector plays an even more central role because of its disproportionate concentration in the region. Yet both nationally and regionally, analysts who wish to use the auto industry as a bellwether for the macroeconomy must be able to distinguish between the industry's cyclical trends on the one hand, and technical or structural trends on the other.
This Fed Letter examines the impact of changes in the auto industry on the regional and national economy, particularly focusing on the unique role it played last year when events in the industry appeared to jeopardize the current expansion.
Summer doldrums
In the summer of 1993, the disproportionate impact of the auto sector on the economy stood out especially clearly. A loss of momentum in the manufacturing sector during those months aroused widespread concern about whether the economic expansion could be sustained. Factory orders and shipments declined sharply in July (down 2.6%), capping an almost steady decline in both series since their peak in the first quarter. Similarly, the manufacturing component of industrial production, which had peaked in April, ended July 0.3% lower.
While the slowdown was noticeable in most measures of overall manufacturing activity, it was concentrated in the motor vehicles and parts segment. Build rates during the summer fell below plans to a seasonally adjusted annualized rate of less than 10 million units. Adding to the weakness in production, sales slumped from 14.1 million units during the second quarter to below 14 million units during the summer. Some worried whether that sales weakness would continue past the summer and lead to a further decline in production. If this happened, it would create significant problems for the economic expansion.
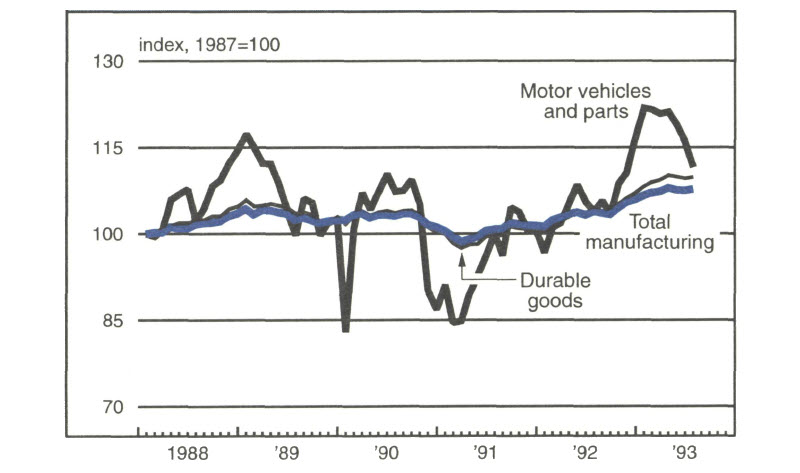
If viewed without an understanding of the adjustments occurring in the auto industry, the summer statistics could have seemed to be cause for alarm. Shipments of autos and parts were down 15.5% in July from their March peak—over five times the decline in total manufacturing shipments. Even though the auto industry accounts for slightly less than 10% of total shipments, the industry's decline accounted (on a share-weighted basis) for half of the total decline in manufacturing shipments and for about 85% of the decline in durable goods manufacturing (see figure 1). In industrial production, the decline in the autos and parts component in April (-0.8%) was nearly three times greater than the decline in total manufacturing. In addition, the slump in auto production had effects on supplier industries such as rubber, glass, and steel, that generated additional weakness in durable goods manufacturing. Thus, while there were certainly other sources of drag on the manufacturing sector, the weakness in auto production was the critical factor. The real question was whether it was signaling a weakening overall market, or whether it was an aberration due to one-time factors.
1. U.S. industrial production
The auto slowdown as an aberration
In fact, much of the summer slowdown in auto production was due to temporary supply-side interruptions—especially at General Motors plants—rather than a sudden downward shift in demand for autos. A large portion of the slowdown was attributable to model changeovers, particularly in May and June, and to technical difficulties in getting plants running on schedule in August. For example, car assemblies over the first four months of the year averaged an annualized rate of 6.3 million units, then fell to about 5.9 million over May and June. By July and August the rate had dropped below 5.5 million. Light truck production, which had averaged an annualized rate of about 4.6 million during the first four months of the year, dropped to 4.2 million in May and June and 4.0 million in July. The shortage of supply caused by the production problems had some impact on sales as well.
Fortunately, production estimates suggested that the underbuild would not continue past the summer. The initial build schedules for the fourth quarter, announced during the summer doldrums, called for production of over 2.9 million units (1.6 million cars and 1.3 million light trucks), a 12% increase over the year-earlier rate. This would be the highest fourth-quarter rate since 1988. Moreover, tight inventories were also reassuring, indicating the need to boost output in the fourth quarter.
As it turned out, fourth-quarter auto production almost exactly matched planned schedules. This output boosted the macroeconomy substantially, contributing over one-third of all growth in gross domestic product (GDP) during the fourth quarter. In fact, the snapback of the U.S. economy in the fourth quarter is directly correlated to the expansion in vehicle production and sales. Industrial production rose 0.7% in October and 0.9% in November, both largely because of a 20% increase in production of motor vehicles and parts between August and November. Similar strong gains in factory orders and shipments could be traced to this sector as well.
All these events affected the Midwest disproportionately because of the concentration of the auto industry here. The summer slump in economic activity was almost completely confined to the region, as it was due primarily to the technical problems at Midwest auto plants (see figure 2). As a result, although overall production levels in the Midwest had started the year 40% above year-ago levels, during the summer they fell below year-ago levels. Similarly, the region benefited disproportionately from the auto production catch-up during the fourth quarter.
2. Light vehicle production by region
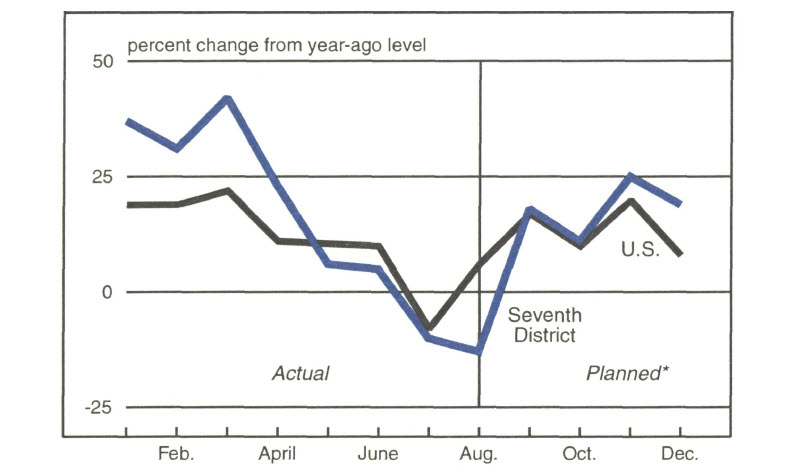
Note: The Seventh Federal Reserve District includes Illinois, Indiana, Iowa, Michigan, and Wisconsin.
Source: Federal Reserve Bank of Chicago.
Fundamentals offset temporary slump
After a disappointing third quarter, total car and light truck sales in October and November returned to a relatively healthy annualized rate of 14.6 million to 14.7 million units. Total vehicle sales for the quarter reached their highest level since the fourth quarter of 1989. Some analysts within the industry expect 1994 sales to exceed 15 million units, though this figure may be overly optimistic. At the other extreme, some doubters question whether the pace of auto recovery is out of line with the subpar pace of the overall economic expansion. If so, the current rate of vehicle sales would not be sustainable, and a slowdown in sales during 1994 could spill over into the rest of the economy.
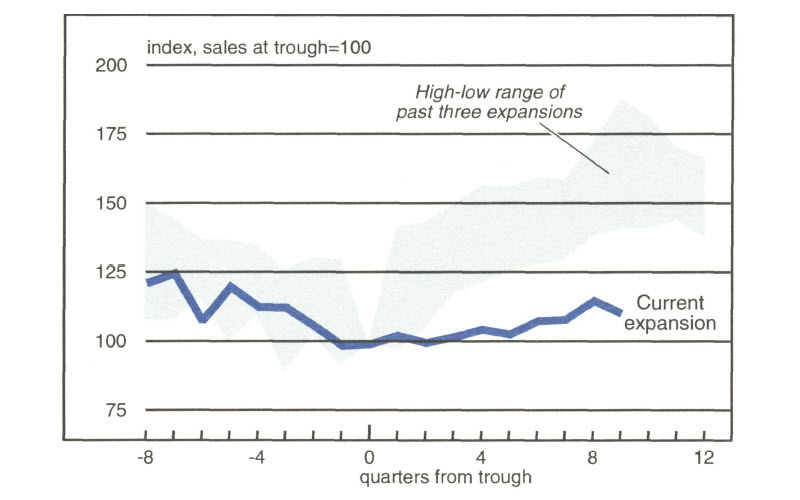
Clearly the question is: Has the recent recovery in autos been abnormal, or is it largely consistent with general economic conditions? To answer this question, it is useful to view the rate of expansion in vehicle sales in the context of past expansions. Compared with the highs and lows of the previous three expansions (following troughs in 1970, 1975, and 1982), the recent gains since the trough in the second quarter of 1991 have clearly been subpar (see figure 3). Indeed, auto sales since that trough have been markedly below the lowest levels of any previous expansion. This pattern is similar to the recovery in both GDP and consumption expenditures (in constant dollars), relative to their previous cyclical recoveries. Thus, the vehicle sales pattern in this expansion is generally consistent with the subpar nature of the economic expansion.
3. Vehicle sales from cyclical troughs
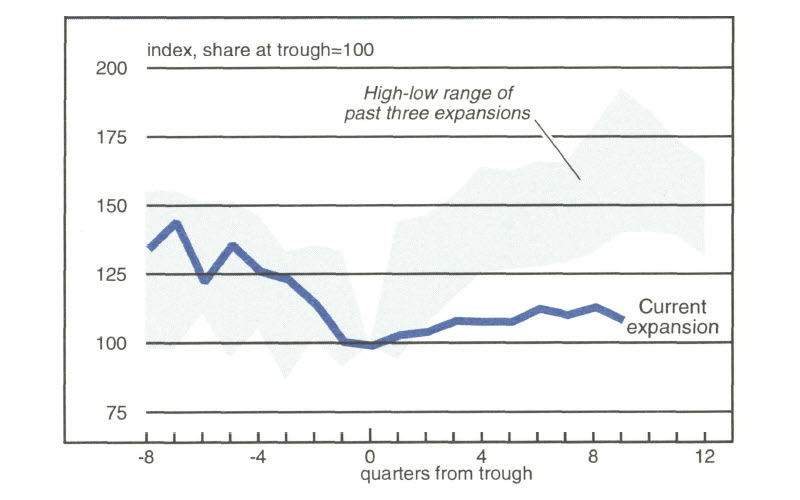
In fact, by some measures, the expansion in the auto industry may be even somewhat weaker than the subpar expansions in the economy or than consumption expenditures would suggest. The question is this: Has the share of consumption going to new vehicle purchases been roughly in line with past recoveries? Even if consumption is weak, consumers may be spending a greater share on autos than on other consumption goods. If so, even though vehicle sales are weak relative to past expansion standards, they may be capturing a greater share of consumption and, therefore, be stronger than expected given the overall strength of the economy. However, the data indicate that the share of consumption expenditures going to new vehicle purchases was actually below the lower bound of the high-low range over past recoveries (see figure 4). Thus, auto sales were in fact below what one would expect, given general economic conditions.
4. Vehicle share of consumption expenditures
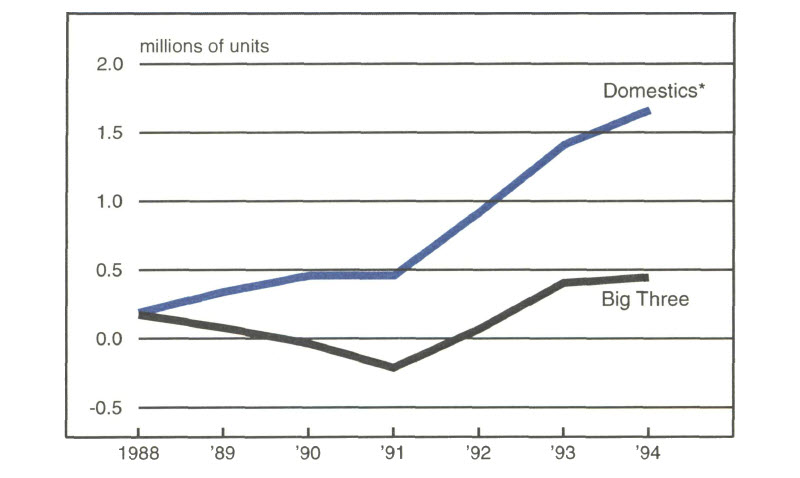
Shifts in domestic market share
Given the weak auto sales, why has there been the perception that autos are leading the recovery? The answer is that sales have shifted away from imports and toward domestically sourced vehicles. Domestic cars increased their market share from 72% in 1988 to 79% in 1993. While transplants increased their share by about 3 to 4 percentage points over the same period, imports declined from nearly 20% in 1990 to less than 15% in 1993. As a result, the auto sector has contributed up to half a percentage point more to GDP growth than it would have if import market share had remained constant at 1986-88 levels.
This shift has occurred along with a gradual improvement in total vehicle sales and has provided an additional spur to the domestic industry as well as to the regional and national economies. As a result, GDP growth rates have gotten an extra boost that would not have occurred in past expansions when import shares were constant or rising. Figure 5 shows what vehicle sales would have been if the average import share had remained at the 1986-88 level. The calculations indicate that 1.7 million fewer domestically sourced vehicles would have been sold in 1993 if import shares had held constant. The Big Three gained about 500,000 of those units and the rest went to transplants. Assuming a typical auto plant produces between 200,000 and 250,000 units, the gains to the Big Three represent keeping two plants open, while the shift to transplants has supported the operation of six new transplant facilities. These data illustrate how structural shifts in the auto industry can cause significant repercussions in the national economy.
5. Sales gain due to increasing market share
Sources: American Automobile Manufacturers Association and Federal Reserve Bank of Chicago.
Conclusion
In addition to its traditional cyclical role, the auto industry has been providing a nontraditional stimulus to the current recovery. During 1993, the industry affected the macroeconomy through a market shift from imports to domestics as well as through temporary disruptions to production activity. Although the auto industry contributes only 5% of total GDP, its impact on the U.S. economy is far greater than that number would suggest. No other sector of this size has a comparable impact.
Given this fact, assessments of macroeconomic activity must take special account of the auto industry. The challenge lies in understanding shortterm aberrations that may occur in the industry as well as the profound structural and cyclical adjustments that are reshaping it. If one ignores the effects of model changeovers and increased domestic sourcing of auto assemblies, one may draw erroneous conclusions about the underlying strength of the economy and the sustainability of the current economic expansion. Conversely, an analysis of such events helps explain the disproportionate impact the auto industry has on the national and regional economies.
Tracking Midwest manufacturing activity
Manufacturing output index (1987=100)
| December | Month ago | Year ago | |
|---|---|---|---|
| MMI | 127.3 | 124.8 | 116.1 |
| IP | 115.3 | 114.5 | 109.3 |
Motor vehicle production (millions, saar)
| December | Month ago | Year ago | |
|---|---|---|---|
| Cars | 6.8 | 6.6 | 6.1 |
| Light trucks | 5.8 | 5.2 | 4.8 |
Purchasing Managers’ Surveys: production index
| January | Month ago | Year ago | |
|---|---|---|---|
| MW | 65.3 | 65.5 | 67.4 |
| U.S. | 62.7 | 63.7 | 64.6 |
Motor vehicle production, millions (saar)
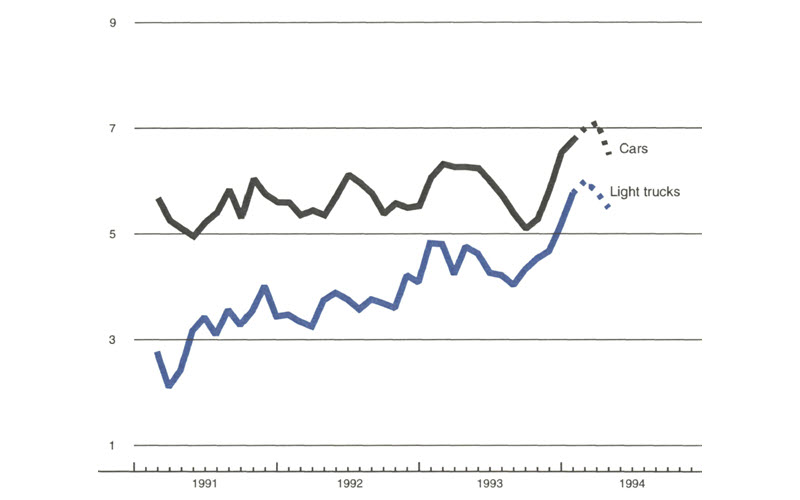
Sources: The Midwest Manufacturing Index (MMI) is a composite index of 15 industries based on monthly hours worked and kilowatt hours. IP represents the FRBB industrial production index for the U.S. manufacturing sector. Autos and light trucks are measured in annualized physical units, using seasonal adjustments developed by the Federal Reserve Board. The PMA index for the U.S. is the production components of the NPMA survey and for the Midwest is a weighted average of the production components of the Chicago, Detroit, and Milwaukee PMA survey, with assistance from Bishop Associates and Comerica.
Light vehicle production rose to a 14-year high in December, with strength in both car and light truck output. Unusually frigid weather prompted plant closings in the second half of January, cutting an estimated 2% from planned first-quarter output. Bad weather also affected sales, but the underlying momentum in the market seemed to remain strong. After the coldest weather passed, automakers actually raised first-quarter output plans. If current schedules are achieved, first-quarter production will continue to rise (on a seasonally adjusted basis) from the fourth quarter of 1993.


