

The following publication has been lightly reedited for spelling, grammar, and style to provide better searchability and an improved reading experience. No substantive changes impacting the data, analysis, or conclusions have been made. A PDF of the originally published version is available here.
The news media often suggest that American workers have suffered a significant decline in job security during the 1990s. This perception is shared by many policymakers, who believe workers’ anxiety is a major reason wage inflation in the mid-1990s remained modest in the face of historically low levels of unemployment.
A large body of research demonstrates that job loss is costly, at least for workers who have attained significant tenure. For example, Jacobson, LaLonde, and Sullivan (1993) found that even six years after job loss, earnings losses among a sample of Pennsylvania workers displaced in the early 1980s were still equal to about 25% of their pre-displacement earnings levels.1 What has been less clear to researchers is whether job loss has become any more common in recent years and, thus, whether workers’ fear of displacement should have increased.
In a recent Economic Perspectives article, we used the U.S. Bureau of Labor Statistics’ (BLS) Displaced Worker Survey (DWS) data to provide new estimates of rates of job loss for high seniority workers through 1995.2 We found that despite falling unemployment rates in the first half of the 1990s, job loss for workers with at least five years of tenure increased. The increase was especially dramatic in job loss due to “shift or position abolished,” which possibly comes closest to capturing the notion of “downsizing.” We also found that displacement had become somewhat more “democratic.” Previously, high-seniority workers who were highly educated, were in white-collar jobs, or were employed in the service-producing industries were relatively immune to displacement. During the early 1990s, however, displacement rates for these groups rose particularly fast, while those for some groups who had high rates of displacement in the 1980s rose less or even fell. As a result, many more workers may have considered themselves at risk for job loss. Such findings added credibility to the idea that worker insecurity was holding down wage increases.
This Chicago Fed Letter updates our job loss estimates using recently released DWS data for 1995 to 1997. We find a general decline in high-tenure displacement rates over the last few years that is consistent with the significant declines in unemployment over this period. We also find further democratization of job loss, as longstanding gaps in displacement rates by education, occupation, and industry decline or disappear by 1997.
Displacement rates for high-seniority workers
Our measures of displacement are based primarily on the DWS. These surveys were conducted as supplements to the Current Population Survey (CPS) in January of even years from 1984 to 1992 and in February 1994, 1996, and 1998. For the purposes of the survey, displacement is defined as involuntary job loss unrelated to workers’ performance. Thus, displacement excludes cases in which workers quit or are discharged for poor performance. The surveys are retrospective, asking individuals whether they have experienced job loss any time over the last five years in the case of the 1984 to 1992 surveys and over the last three years in the case of the 1994 to 1998 surveys. Thus, our earliest information on displacement is for 1979 and our latest is for 1997.
For workers who report that they were displaced in the relevant time period, the DWS asks for the specific reason for their displacement. The possible responses are plant or company closed or moved, insufficient work, position or shift abolished, seasonal job completed, self-operated business failed, or some other reason. This list of reasons is less than ideal. For example, insufficient work might be the reason one of the other events occurred. Moreover, position or shift abolished is intended to cover downsizing, but the reference to shifts may confuse those in nine-to-five environments. Finally, perhaps because of some of the ambiguities of the preceding categories, “other” is an increasingly common response, accounting for a large fraction of the total growth of displacement of high-seniority workers during the 1990s.
In our previous work we focused on all displaced workers, regardless of reason for displacement. However, evidence now indicates that a sizable fraction of the “other” category were not actually displaced. In a BLS debriefing of respondents to the February 1996 survey, only 20% to 30% of those who had initially reported “other” reasons for their job loss gave answers consistent with being displaced.3 It is not clear how to construct a displacement series using the “other” category that is consistent over time. Therefore, in this article, we focus on the first three displacement categories: plant or company closed or moved, insufficient work, and position or shift abolished.
The DWS gives estimates of the number of workers with five or more years of tenure who are displaced in a particular year. To calculate a displacement rate, we need to divide this estimate of the number of high-tenure displaced workers by the number of high-tenure workers who were at risk in that year. We calculated the latter figure as the product of total employment and the fraction of employment accounted for by workers with five or more years of tenure. Our estimated displacement rate is $r^{5}_{t}\!=d^{5}_{t}\,/\,{n}_{t}\,f^{5}_{t}$, where $d^{5}_{t}$ is the number of workers with five or more years of tenure displaced in year t, $n_{t}$ is total employment, and $f^{5}_{t}$ is the fraction of employment accounted for by workers with five or more years of tenure.
As noted above, we derive estimates of $d^{5}_{t}$ from the DWS. To estimate nt, we use the CPS outgoing rotation files. The outgoing rotations are those CPS members who are in their fourth and eighth month of their eight-month participation, about 25% in a given month. Pooling together the outgoing rotations for all 12 months of the year yields quite precise estimates of employment levels. To estimate $f^{5}_{t}$, we use CPS tenure supplements conducted in 1981, 1983, 1987, 1991, 1996, and 1998. To compute displacement rates for 1979 and 1980, we use the value of $f^{5}_{t}$ from 1981. For years in which there was no supplement, we interpolate linearly from the preceding and succeeding tenure supplements. Because the fraction of workers with five years of tenure changes very slowly relative to the number of displaced workers, this interpolation should be quite accurate.
Trends in displacement
Overall displacement rates are plotted in panel A of figure 1. The blue line displays the rate of displacement due to the standard three responses while the black line adds respondents who reported “other” reasons. Comparing the two lines, it is clear that a large part of the significant mid-1990s increase is due to an increase in the number of workers giving “other” as their reason for displacement. The overall, standard-reason displacement rate for workers with five years of tenure rose during the recession of the early 1980s from 1.2% in 1979 to 2.2% in 1982. It then declined during the economic expansion that followed to a low of about 1.3% in 1988. In the early 1990s, it rose rather dramatically. It was not surprising that the rate should have risen during the recession of 1990–91, but at 2.2%, the rate recorded in 1991 was comparable to that in 1982, even though by most measures the 1982 recession was more severe. Since 1993, the displacement rate has fallen, reaching 1.5% in 1997 with much of the decline occurring after 1995. By comparison, the black line that includes the “other” response shows little decline in the rate of displacement, especially through 1995.
1. Displacement rates, workers with five years tenure
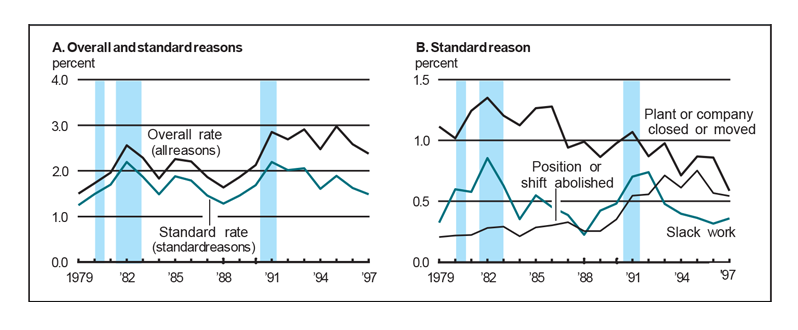
Source: Authors’ calculations based on data from U.S. Department of Labor, Bureau of Labor Statistics, 1988, Displaced Worker Survey, 1984–98.
Panel B of figure 1 displays displacement rates for the three standard reasons. The most notable feature is the sharp increase from 1990 to 1995 due to shifts or positions abolished. This rate, which comes the closest to capturing downsizing, was between 0.2% and 0.3% from 1979 to 1989, but rose to roughly 0.8% in 1995 before sliding back to 0.5% in 1997. Even with the recent decline, the rate remains twice as high as in the 1980s.
Figure 2 shows standard-reason displacement rates for several major groups. Panel A displays the rates for men and women. For most of the period covered by our data, high-tenure women were less subject to displacement than men, with the typical gap in rates being five- or six-tenths of a percentage point. In the last five years, however, the gender gap has disappeared. Since 1995, the displacement rate for women even exceeds that of men by about one-tenth of a percentage point. Thus, by our measure, women have suffered a larger decline in job security than men.
2. Displacement rates, workers with five or more years tenure, by category
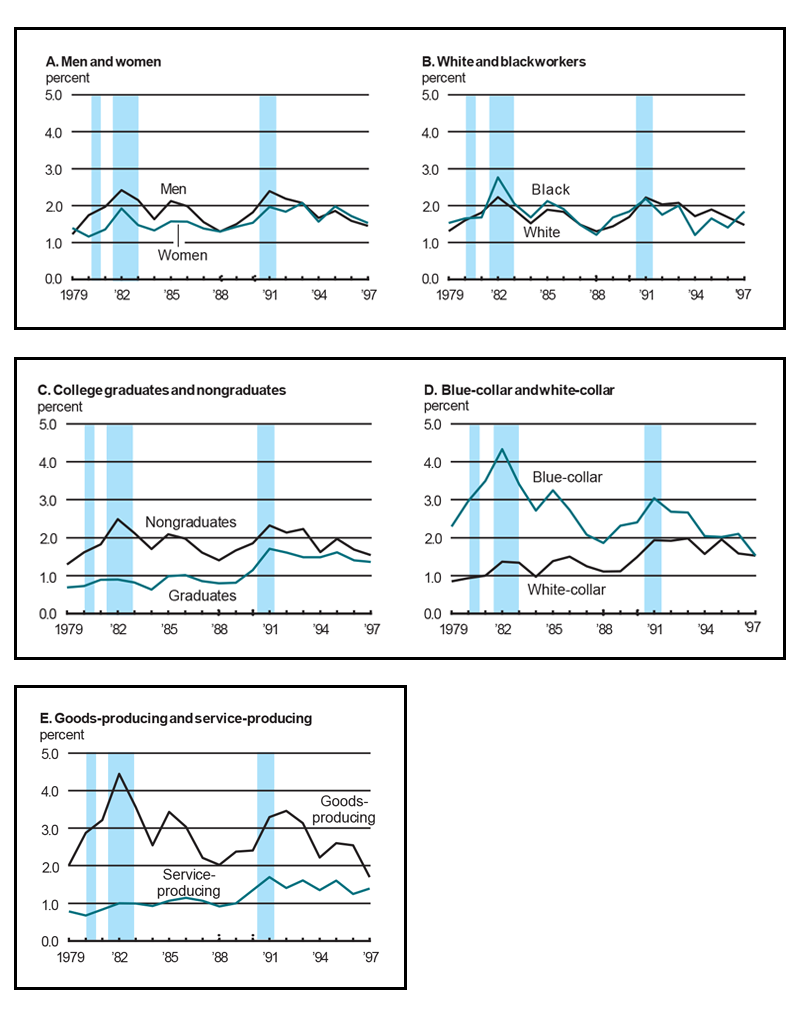
Source: Authors’ calculations based on data from U.S. Department of Labor, Bureau of Labor Statistics, 1998, Displaced Worker Survey, 1984–98.
Panel B of figure 2 displays displacement rates for White and Black workers. At least in our samples of high-tenure workers, racial differences are relatively minor. Still, there have been some changes over time. Early in the period, especially during the recession of the early 1980s, Black workers had noticeably higher displacement rates. However, in the mid-1990s, it was White workers who had higher rates of displacement. By 1997, a sharp decline in the displacement rate of White workers combined with an increase in the rate for Black workers had caused yet another switch.
Panel C shows the breakdown between those with and without a college degree. Although displacement rates for college graduates remain lower than those for nongraduates, the gap has narrowed considerably in the 1990s. Until 1990, displacement rates for college graduates never exceeded 1% and the gap between them and non-college graduates was often a percentage point or more. In the early 1990s, displacement rates for college graduates rose sharply, leveling off at roughly 1.5% for much of the 1990s. Conversely, the rate of displacement for non-college graduates has declined steadily from 2.3% in 1991 to 1.5% in 1997. Thus, the gap in displacement rates between those with and without a college degree has narrowed considerably over the last ten years.
Panel D shows displacement rates for blue-collar and white-collar workers. Similar to the education gaps reported in panel C, what once had been a sizable difference between high-tenure blue-collar and white-collar workers had disappeared by 1997. Rates of job loss among white-collar workers steadily increased from the late 1970s to the mid-1990s with the biggest gains occurring during the early 1990s. Over the last seven years, displacement rates have remained relatively flat for these workers despite sharp declines in the unemployment rate. By contrast, blue-collar workers have seen their rate of displacement decline steadily from over 3% in 1991 to 1.5% in 1997.
Finally, panel E shows displacement rates for workers in goods-producing and service-producing industries. Again, a large gap in rates in the 1980s narrowed to lower levels by 1997. Displacement rates for those in goods-producing industries are significantly lower than in 1982, but rates for those in the service-producing industries are about 40% greater. Even so, workers in goods-producing industries remain more at risk for displacement. More dramatic changes can be identified for certain industries. For instance, displacement rates for workers in the finance, insurance, and real estate industries rose from only about 0.5% in the early 1980s to 3% in 1997.
Conclusion
Our results point to a decline in high-tenure displacement rates since 1995. If worker insecurity, as has often been hypothesized, depresses wage growth, wage gains should have increased in response to the lower displacement rates after 1995. Compensation measures such as the BLS’s Employment Cost Index do show an acceleration in this period. Whether the magnitude of this acceleration is consistent with the observed decreases in displacement and unemployment is, however, beyond the scope of the present article.
We also found that those who were most prone to job loss in the 1980s, such as those without a college education, in blue-collar jobs, or in goods-producing industries, experienced the largest declines in job displacement. Displacement for groups that might once have considered themselves immune to job loss declined substantially less. As a result, previously large gaps in displacement by education, occupation, and industry had virtually disappeared by 1997.
Tracking Midwest manufacturing activity
Manufacturing output indexes (1992=100)
| August | Month ago | Year ago | |
|---|---|---|---|
| CFMMI | 125.9 | 121.7 | 123.2 |
| IP | 132.0 | 129.5 | 127.9 |
Motor vehicle production (millions, seasonally adj. annual rate)
| September | Month ago | Year ago | |
|---|---|---|---|
| Cars | 6.5 | 6.3 | 6.1 |
| Light trucks | 5.9 | 6.6 | 6.1 |
Purchasing managers' surveys: net % reporting production growth
| October | Month ago | Year ago | |
|---|---|---|---|
| MW | 57.3 | 67.8 | 62.6 |
| U.S. | 52.6 | 53.4 | 59.6 |
Purchasing managers’ surveys (production index)
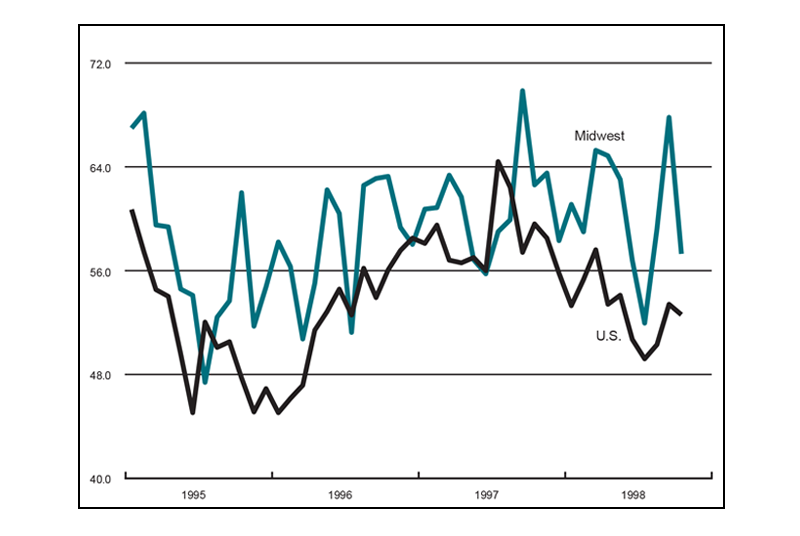
The Midwest purchasing managers’ composite index (a weighted average of the Chicago, Detroit, and Milwaukee surveys) for production decreased from 67.8% in September to 57.3% in October. Purchasing managers’ indexes decreased in Chicago, Detroit, and Milwaukee. The national purchasing managers’ survey for production declined from 53.4% in September to 52.6% in October.
The CFMMI rose 3.5% from July to August, to a level of 125.9; revised data show the index fell 2.1% in July. The Federal Reserve Board’s IP rose 2.0% in August after dropping 0.4% in July. Light truck production decreased to 5.9 million units in September from 6.6 million units in August. Car production increased to 6.5 million units from 6.3 million units during this time.
Notes
1 Louis Jacobson, Robert LaLonde, and Daniel Sullivan, 1993, “Earnings losses of high-seniority displaced workers,” Economic Perspectives, Federal Reserve Bank of Chicago, Vol. 17, No. 6, November/December, pp. 2–20.
2 For greater detail on the data issues and computations, see Daniel Aaronson and Daniel Sullivan, 1998, “The decline of job security in the 1990s: Displacement, anxiety, and their effect on wage growth,” Economic Perspectives, Federal Reserve Bank of Chicago, Vol. 22, No. 1, First Quarter, pp. 17–43.
3 Katherine G. Abraham, 1997, “Comment on ‘The changing face of job loss in the United States, 1981–1995’,” Brookings Papers on Economic Activity: Microeconomics, pp. 135–141. For details on the debriefing, see James L. Esposito and Sylvia Fisher, 1998, “A summary of quality-assessment research conducted on the 1996 displaced-worker/job-tenure/occupational-mobility supplement,” U.S. Bureau of Labor Statistics, statistical note, No. 43.


