

In the late 1980s and early 1990s, the Midwest’s economy outperformed the nation in practically every measurable category. Employment growth was stronger, unemployment rates were lower, housing and construction activity was more robust, and the manufacturing sector was operating at higher levels of production. Recently, however, the Midwest’s economy has lost some of its momentum. Perhaps most significantly, employment growth in the region has fallen below the national average and the gap is widening.
Why has the Midwest’s job growth fallen below that of the nation? In previous periods of slowing job growth, deteriorating economic conditions were most often paramount. In the current expansion, demand for some of the region’s key outputs (automobiles, for example) has matured at very high levels. At the same time, however, labor markets have tightened dramatically throughout the region, leading some to examine the possibility that a limited supply of workers is hindering the region’s growth.
In this Chicago Fed Letter, I examine some of the available measures of labor market activity and offer an interpretation of what these data mean and what implications they hold for our region’s continued economic growth heading into 1998. The preponderance of evidence suggests that labor market tightness is the defining variable of the Midwest’s recent slowdown in job growth.
The Midwest’s revival
Structural changes in the Midwest have left the economic landscape significantly different from what it was in the late 1970s and early 1980s. While these changes brought tremendous upheaval for many of the Midwest’s workers, they were, in part, also responsible for the rebirth of the region’s economy. This rebirth became evident in the recession of the early 1990s. For the first time in the post-World War II era, the Midwest’s economy did not lead the nation into, or lag the nation out of, an economic downturn. Average annual unemployment rates dramatically illustrate this point. In stark contrast to the recessions of the early 1980s—when the Midwest’s unemployment rate rose much faster and much higher than the nation’s—the early 1990s recession saw a continued convergence in the unemployment rates, a trend which had begun in 1982. In May 1992, the seasonally adjusted unemployment rate for the Midwest fell below the rate for the nation for the first time in over a decade. It has remained below the national level since.
This trend was the result of strong employment growth in the region combined with net outmigration, which reduced the region’s potential pool of labor. Though the drop in the region’s unemployment rate was dramatic in the mid-1980s, growth in employment was less so. However, from 1987 to 1993, the employment growth of the Midwest outpaced that of the nation, led in large part by a rejuvenated manufacturing sector. While the region’s payrolls contracted in the 1991 recession, the rate of job loss was 22% lower than the nation’s. This compares with job losses that were nearly 80% higher for the region than for the nation in 1982, the last year the country as a whole experienced shrinking payrolls.
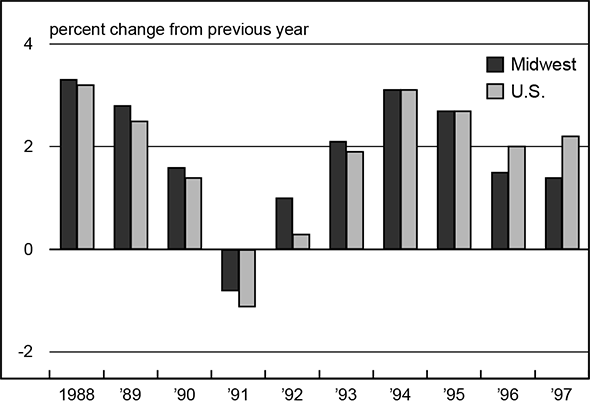
By 1994, however, job growth in the nation had caught up to the Midwest and, by 1996, had surpassed it. In 1997 (year-to-date through September), the Midwest’s job growth was only about 1.4% compared to the nation’s 2.2%. For the first time in more than 20 years, the growth trend in the region did not follow that of the nation. In previous years, when employment growth in the nation increased (decreased) the growth rate in the region also increased (decreased). But in 1997, as employment growth began to pick up for the nation as a whole, growth in the region continued to fall from its 1994 high (figure 1).
1. Employment growth
Job destruction versus job creation
Whether the Midwest’s slowing employment growth is attributable to deteriorating economic conditions (softening demand for its goods and services) or capacity constraints (specifically, labor) can be determined by examining the components of net employment growth. Net employment growth is a function of both job creation and job destruction. Intuition, as well as mathematics, tells us that if job destruction increases at a faster rate than job creation in any given period, net employment growth decreases. The opposite would be true if job creation were to outpace job destruction. Thus, slowing net employment growth can be caused by an increase in job destruction, a decrease in job creation, or both.
During periods of general economic slowdown, firms will respond to decreasing demand by slowing production. This is usually done by either idling equipment or workers, or both. Since plant and equipment are regarded as fixed costs, the more readily available option is to idle workers. More layoffs mean more job destruction.
In the absence of a comprehensive and timely measure of job destruction, one can examine administrative data from the unemployment insurance system. One source is the initial unemployment claim (IUC) data estimated by the Department of Labor. One can argue that a surge in the rate of job destruction in any given period would lead to more workers registering with their local unemployment office for benefits. In turn, an increase in the level of initial unemployment claims would also seem logical, as would a decrease in the rate of employment growth.
This scenario assumes, of course, that the rate of job creation did not keep pace with job destruction in the period. If the rate of job creation were to increase proportionately with the rate of job destruction, laid-off workers could be quickly reabsorbed into the ranks of the employed and there would be no change in the level of IUCs. In other words, the net rate of job destruction would remain unchanged. Subsequently, if employment growth were to slow in this period under these assumptions, it would not be as a result of an increase in the net rate of job destruction.
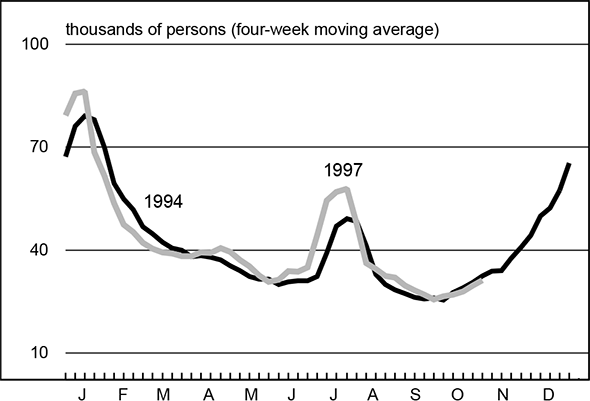
The IUC data for the Midwest suggests that an increase in the net rate of job destruction is not a contributing factor in the region’s slowing rate of employment growth. The level of initial claims in 1997 is nearly identical to that of 1994, a year in which net employment growth was more than double 1997’s rate (figure 2). While this does nothing to address the issue of labor demand, it does imply that slowing employment growth (unlike previous periods of slowing growth) is not the result of deteriorating economic conditions that would be reflected in an increase in the net rate of job destruction.
2. Midwest initial unemployment claims
The slowing rate of employment growth appears then to be in the rate of job creation. This is not to say, however, that employers in the Midwest do not want to hire more workers and produce more goods and services. They do. The demand for workers in the region remains very high and, by some measures, is greater than national demand.
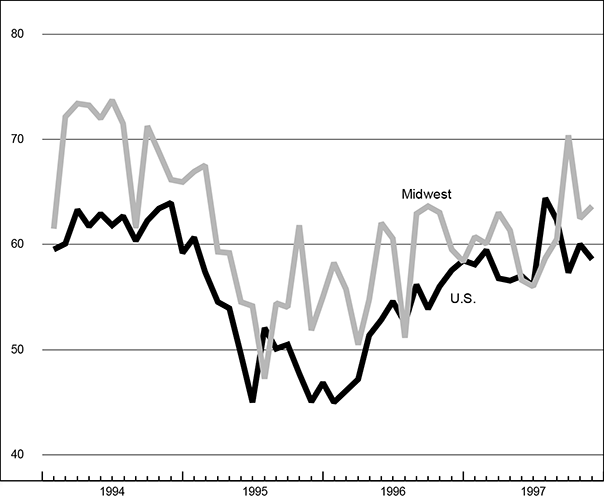
Two measures that give us insight, albeit rudimentary, into the demand for labor are hiring plans and help-wanted indexes. With few exceptions in the 1990s, the quarterly hiring plans of midwestern businesses have been higher than their national counterparts. Perhaps more interesting, the Midwest’s index was growing faster in the 1994–96 period at the very time that the region’s employment growth was slowing relative to the nation’s. This pattern holds true in another measure of labor demand—the index of help-wanted advertising in major newspapers. The regional help-wanted index grew much faster and remained much higher than the national index through 1994 and 1995. There appears to be a dichotomy between the number of workers the region’s employers want to hire and the number they actually do hire.
Labor markets tighten
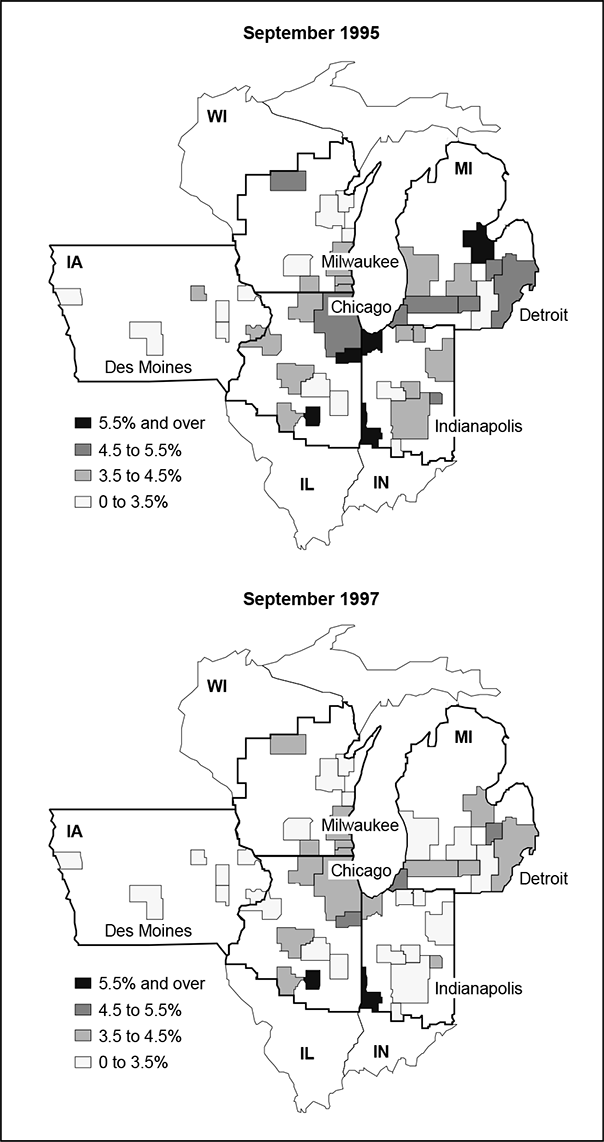
This dichotomy can largely be explained by the Midwest’s tight labor markets. Unemployment rates in midwestern states averaged 4% year-to-date through September 1997, a full percentage point below the national average. In fact, September marked the 65th consecutive month that the region’s rate was below the nation’s. Each midwestern state’s unemployment rate was below the national average for 1997 (year-to-date), ranging from a low of 3.1% in Iowa to a high of 4.7% in Illinois. Labor markets have also tightened universally across the region’s metropolitan areas (figure 3). Fully 60% of the Midwest’s metropolitan areas had unemployment rates below 3.5% in September 1997 and 39 of the 43 were below the national average. The rates ranged from a low of 1.5% in Madison, Wisconsin, to a high of 6.1% in Decatur, Illinois.
3. Metropolitan area unemployment rates
But the story of tight labor markets does not end with low unemployment rates. The Midwest not only has a greater percentage of its labor force employed compared with the nation, but also has a larger percentage of its population actively participating in the labor force. Thus, the region is not just running out of workers, it is running out of potential workers.
The percentage of the working-age population in the Midwest currently employed is much higher than that of the nation as a whole, 66.2% versus 63.2%. Only the West North Central region (69.9%) has a greater proportion of its population employed. Between 1982 and 1997, the employment to population ratio increased dramatically in the Midwest. Much of the early gain resulted from the reemployment of unemployed and underemployed workers idled by the deep recessions of the early 1980s. Since 1993, however, the increase largely reflects two factors: 1) the entrance of nontraditional workers (homemakers, retirees, etc.) into the labor force, and 2) a relative lack of in-migration which has limited the growth potential of the labor force. Earlier in the decade, labor force growth had been expanding rapidly to keep up with the pace of employment growth, but there are signs that this growth has reached a plateau.
Conclusions
While labor market tightness alone does not rule out the possibility that demand for labor has softened, evidence from the hiring plans and help-wanted indexes, as well as anecdotal information, suggests otherwise. Many businesses in the Midwest are very optimistic about their expansion plans, but their growth potential will be limited by the shortage of qualified workers. Evidence reflective of the region’s labor demand and labor supply suggests the region’s employment growth in 1998 will continue to lag the nation’s, though this certainly does not imply a deterioration in economic conditions. Other economic activity in the region—housing, retail sales, and manufacturing—will continue at a very high level but will not experience the growth rates achieved earlier in the decade.
We would be remiss to conclude without mentioning the wage effects of very tight labor markets. Taking into consideration the circumstances—the point we’re at in the business cycle and the short supply of, and continued strong demand for, labor—wages have been remarkably well behaved. Several current theories have been extolled to explain this phenomenon. One of the tenets of the “New Economy” theory indicates that increased integration in the world economy means that capacity constraints (including labor) in the face of increasing demand are not as binding as in the past. As a result, increased wage pressures are no longer as imminent. If true, one would expect this to hold to an even greater extent within U.S. regions, where integration and trade flows are more common. Production from one region bumping up against capacity (labor) constraints would be expected to “spill over” to other regions facing no such constraints. This scenario assumes, however, that there is excess capacity elsewhere. As the economies on both U.S. coasts are rebounding and regional unemployment rates are converging, excess labor capacity could be drying up. Perhaps 1998 will be the year that determines whether the New Economy paradigm “holds water.”
Tracking Midwest manufacturing activity
Manufacturing output indexes (1992=100)
| September | Month ago | Year ago | |
|---|---|---|---|
| CFMMI | 123.8 | 123.7 | 118.0 |
| IP | 124.2/td> | 123.6 | 117.4 |
Motor vehicle production (millions, seasonally adj. annual rate)
| October | Month ago | Year ago | |
|---|---|---|---|
| Cars | 6.0 | 6.1 | 5.5 |
| Light trucks | 6.3 | 6.2 | 5.4 |
Purchasing managers’ surveys: net % reporting production growth
| November | Month ago | Year ago | |
|---|---|---|---|
| MW | 63.7 | 62.5 | 59.6 |
| U.S. | 58.6 | 60.0 | 57.5 |
Purchasing managers’ surveys (production index)
The Midwest purchasing managers’ composite index (weighted average of the Chicago, Detroit, and Milwaukee surveys) for production increased to 63.7% in November from 62.5% in October. Purchasing managers’ indexes increased in Chicago and Detroit from the previous month and declined only slightly from the previous month’s level in Milwaukee. The national purchasing managers’ composite index decreased from 60% in October to 58.6% in November. The Midwest purchasing managers’ index has been above 50% for more than two years (since July 1995). The national index has been above 50% since March 1996.


