

The following publication has been lightly reedited for spelling, grammar, and style to provide better searchability and an improved reading experience. No substantive changes impacting the data, analysis, or conclusions have been made. A PDF of the originally published version is available here.
The population of the Chicago metropolitan area grew by 869,000 (11.6%) between 1990 and 2000, the largest decade of growth in 30 years.1 The gain of 112,000 in the City of Chicago was the first in more than 50 years. Overall, gains were greatest in the outer suburbs and smallest in the city. Much of this growth was fueled by immigration and natural increase, with Hispanics contributing disproportionately to both.
According to recent U.S. census data, the Chicago metropolitan area experienced widespread population gains between 1990 and 2000. These population gains are evident in the City of Chicago, as well as in suburban Cook County and the outer ring of the metropolitan area. The overall population gain in the metro area was 11.6%, making this the largest decade of growth in 30 years. The accelerated rate of population increase in Chicago mirrors that in the East North Central census region (Illinois, Indiana, Ohio, Michigan, and Wisconsin) and in the U.S. Between 1990 and 2000, the East North Central region grew 7.5% and the U.S. grew 13.2%. Both these gains are the largest since the 1970s. Relative to other cities, Chicago’s population gain in the 1990s ranked sixth overall among the ten largest metropolitan areas in the country.
This Chicago Fed Letter summarizes recent demographic trends in the Illinois portion of Chicago’s consolidated metropolitan statistical area,2 based on data from the U.S. Census Bureau, the National Center for Health Statistics, and the Illinois Department of Public Health.3 These data reveal the complex interaction of demographic forces that together produced the area’s population gain.
Overview of population change
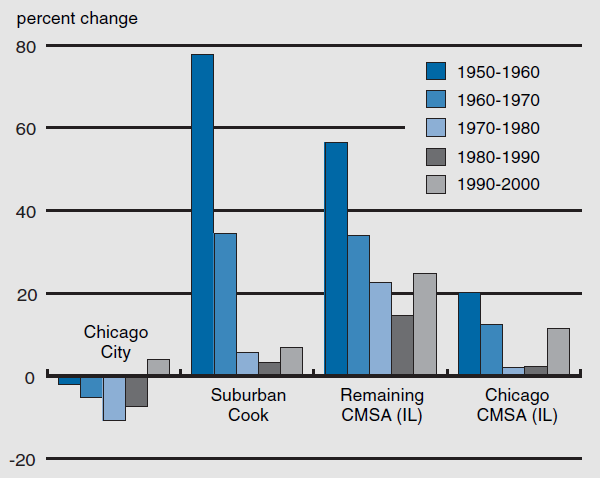
The population of the Chicago metropolitan region grew by 869,000 (11.6%) between 1990 and 2000. The region had a total population of 8,376,601 in April 2000, making it the third largest metro region in the country. Gains were greatest in the outer suburbs and smallest in the city. The population increase of 112,000 in the City of Chicago was the first in more than 50 years (figure 1). Suburban Cook County gained 159,000 people during the period and the outer suburbs gained approximately 598,000. Roughly 34.6% of the area’s population reside in the City of Chicago, 29.6% live in suburban Cook County, and the remaining 35.8% reside in the outer suburbs. Chicago’s share of regional population has declined over the past several decades, while suburban Cook County’s and later the outer suburbs’ shares have increased.
1. Population percent change, 1950-2000
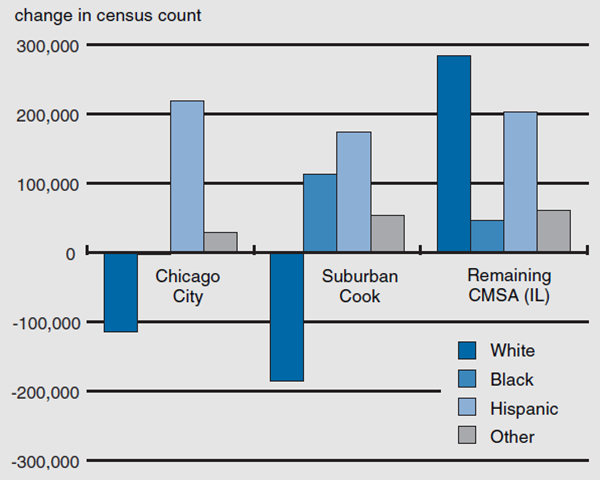
Hispanics fueled most of the growth in the City of Chicago, whereas the White and Black populations declined. The Hispanic population of the city increased by 220,000 between 1990 and 2000. This gain offset a substantial net loss of non-Hispanic Whites (134,000) and a minimal loss of Blacks (3,000). The “other” category (which is primarily Asians) also grew during the period (figure 2). The population of suburban Cook County also grew in the 1990s. Population gains there resulted from the growth of the Hispanic, Black, and other groups. These gains offset the loss of 184,000 Whites. Population growth was greatest in suburban areas beyond Cook County, because net migration and natural increase gains were substantial. All four racial/ethnic groups gained population in the outer suburbs, with the largest gain experienced by the White population (285,000). Hispanics experienced substantial growth (204,000) as well, whereas gains to the Black and other categories were more modest.
2. Change in racial/ethnic distribution, 1990–2000
The distribution of racial/ethnic groups within the three areas shifted during the decade as a result of these trends. Blacks (37%) were the largest group in Chicago in 2000, followed by Whites (32%) and Hispanics (26%). The other group (largely Asian) and the new “two or more races” category represented much more modest proportions of the city population. Suburban Cook County remains nearly 68% White, despite a 10% decline in the 1990s. The outer suburbs are approximately 78% White. Now, I consider the dynamics underlying this broad picture of population change in Chicago.
Importance of migration and natural increase
Natural increase (the excess of births over deaths) is a significant source of population increase in nearly every large metropolitan area. However, net migration (the difference between the number of individuals moving into and out of an area) has a far more differential effect. We can break down overall migration change into two separate components. The first is domestic migration, which involves movement from one part of the U.S. to another. The second type of migration is net immigration, which is the difference between the number of people coming into an area from outside the U.S. and the number of people from the area leaving the U.S. Both types of migration played an important role in the Chicago metropolitan region between 1990 and 2000.
Recent research4 suggests that some large metropolitan areas (e.g., New York, Los Angeles, and San Francisco) have experienced net domestic out-migration but have received a significant net influx of immigrants. A second group of metropolitan areas (e.g., Atlanta, Denver, and Phoenix) have received a significant gain from domestic migration, but relatively few immigrants. Chicago’s migration experience is consistent with that of the first group. The Chicago metro area experienced an overall net migration gain of 164,000 (2.2%) between 1990 and 2000. This gain resulted from a net influx of approximately 408,000 immigrants that was sufficient to offset the net loss of 244,000 domestic migrants. The attractiveness of the Chicago metro area to immigrants differentiates it from the rest of the East North Central region. Although Chicago contains only 18.6% of the region’s population, it received 63.1% of all immigrants to the region between 1990 and 2000.
The City of Chicago experienced a net migration loss of 176,000 in the 1990s. This loss occurred because the net outflow of domestic migrants from the city was only partially offset by a net gain from immigration (figure 3). Although still substantial, the city’s migration loss between 1990 and 2000 is considerably smaller than the losses during the three prior decades. Suburban Cook County gained approximately 18,000 net migrants during the decade, because net immigration gains were sufficient to offset a net loss of domestic migrants. The remainder of the Chicago region experienced a net migration gain of 322,000, fueled by both domestic m grants and immigrants.
3. Components of population change, 1990–2000
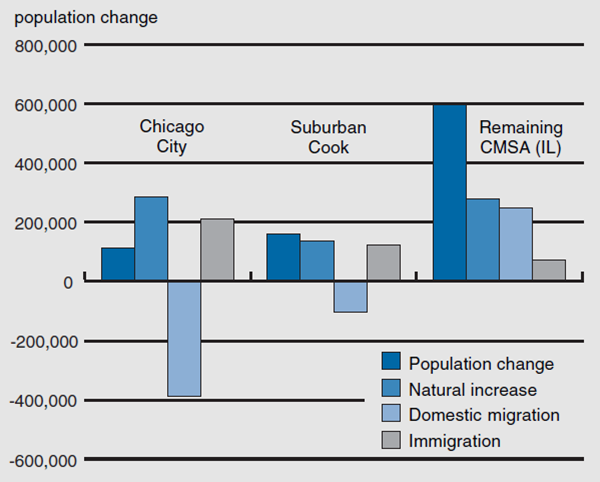
Natural increase also contributed to the growth of the population in each of the three subregions of the metro area. There were a total of 1,350,000 births and 645,000 deaths in the region between 1990 and 2000, producing a population gain attributable to natural increase of 705,000. The excess of births over deaths was 288,000 (10.3% of the total population) in the city, 142,000 (6.1%) in suburban Cook County, and 276,000 (11.5%) in the outer suburbs. These natural increases offset the migration loss from the city, supplemented the modest migration gain in suburban Cook County, and added to the substantial migration gain in the outer suburbs.
An examination of net migration and natural increase by racial/ethnic group reveals the complex dynamics of demographic change in the metropolitan region. In the City of Chicago, the non-Hispanic White population experienced both net out-migration (–120,000) and natural decrease (–13,000) between 1990 and 2000 (figure 4). Natural decrease occurred in the White population because deaths exceeded births. There was also significant Black net out-migration (–132,000) from the city during the 1990s, though it was largely offset by natural increase (129,000). In contrast, Hispanics experienced both substantial natural increase (156,000) and significant net migration gains (65,000). However, it is important to note that more than two-thirds of Hispanic growth in the city was a function of natural increase. This refutes a commonly held notion that Hispanic population growth in the city is mostly due to immigration. The primarily Asian population of the other category also enjoyed both natural increase and net migration in the 1990s.
4. Natural increase and net migration, 1990–2000
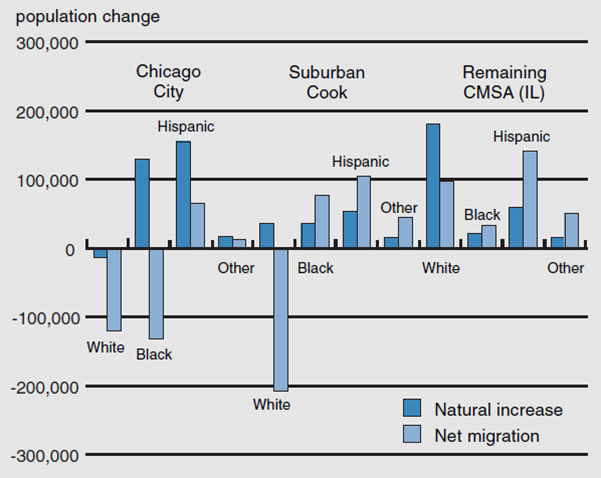
The White population recorded a net outflow of 208,000 from suburban Cook County between 1990 and 2000. Modest natural increase only partially offset this loss. Most of the Black population gain in suburban Cook County resulted from migration, though there was also significant natural increase. The two combined to produce a 50% increase in the number of Black residents in suburban Cook County. Hispanics also enjoyed significant natural increase and substantial in-migration in suburban Cook County, as did the other category. Part of the reason for the large percentage gains in the Black and Hispanic populations in the suburbs is that both groups were growing from a relatively small base in 1990. However, even if measured in absolute rather than percentage terms, the growth of the Black and Hispanic populations in the suburbs has been substantial. By 2000, Black residents represented 13.8% of the population of suburban Cook County and 5.6% in the outer suburbs. Hispanics were 13% of the suburban Cook County population and 11.8% in the outer suburbs.
In the outer suburbs, significant natural increase combined with substantial net migration gains to produce a large population gain for each of the four groups. The outer suburbs are the only part of the metropolitan area that had a net inflow of Whites. Population gains were greatest among Hispanics, who grew 136% between 1990 and 2000. Most of this growth was from net migration. Migration gains were also substantial for the largely Asian other category.
Understanding a natural decrease
Although it does occur occasionally, natural decrease has been uncommon in metropolitan areas. Yet, deaths exceeded births in the City of Chicago’s White population segment in every year from 1990 to 1999. This trend likely developed in the 1980s and is known to have occurred in some parts of the city during the 1970s. Most natural decrease in the U.S. results from age structure shifts that leave an area with relatively few adults of child-bearing age and many older adults with high mortality risk. The situation is rather more complex in the City of Chicago. Whites do represent a disproportionate share of the city’s older population, but they also constitute a significant share of the population of childbearing age. Thus, while it is understandable that deaths in the White group represent 49% of the city total, it is less clear why Whites produce only 21% of city births. Nor is White natural decrease restricted to the city. In 1999, deaths among the White population in suburban Cook County exceeded births—probably for the first time in history. In 1998–99, 19 other Cook County cities experienced overall natural decrease.
Social and political implications of demographic change
Two interesting findings illustrate the implications of demographic change for the area. The relatively small number of births among Whites in the city has significant implications for efforts by the school system to foster diversity. Indeed, the problem is exacerbated by the age-specific migration patterns of young White adults in the region. Fewer than 53% of the White babies born in the city remain as five- to nine-year olds. The only plausible explanation for a decline of this magnitude is that families with young children leave the city in significant numbers during their children’s preschool years. Although the out-migration of families with children from the city is a well-known phenomenon, the magnitude of the loss among non-Hispanic Whites is surprising. The data also show a smaller, but still significant loss of Black children (74% remaining). In contrast, children of Hispanics (94% remaining) and the largely Asian other group (91% remaining) are much more likely to begin school in the city.
The demographic changes occurring in the region also have political implications. For example, the fact that the older population in Chicago is disproportionately White means that although they represent only 32% of the population, whites constitute 45% of registered voters. Blacks are also slightly overrepresented among registered voters (37% of population and 39% of registered voters). In contrast, both Hispanics (26% of population and 13% of registered voters) and the largely Asian other category (6% of population and 3% of registered voters) constitute much larger proportions of population than of those registered to vote. The underrepresentation of Hispanics and Asians (other) underscores the linkage between demography and voting as both these groups have lower citizenship rates; the Hispanic population also is considerably younger than any of the other groups.
In conclusion, the significant population gains in each subarea of the Chicago metropolitan region between 1990 and 2000 represent a sharp contrast to the minimal gains in the suburbs and the population decline in the city during the 1980s. These recent population gains resulted from a complex interplay of fertility, mortality, domestic migration, and immigration.
Most of the region’s growth was fueled by immigration and natural increase, with Hispanics contributing disproportionately to both. The Chicago area continued to experience significant net domestic out-migration, especially from the city and suburban Cook County. Most of this net migration loss occurred among non-Hispanic Whites.
Predicting Chicago’s demographic future is perilous, as the roller coaster of demographic change over the past several decades clearly testifies. Migration is the most volatile element in the demographic equation, affected as it is by a myriad of economic, social, and political forces that are, in turn, influenced by a variety of local, national, and international factors.
Notes
1 This article is drawn from a lecture given by the author at the Federal Reserve Bank of Chicago on October 24, 2001.
2 For purposes of this study, the Chicago region is defined as the Illinois portion of the Chicago, Kenosha, and Gary consolidated metropolitan statistical area. This includes Cook, DeKalb, DuPage, Grundy, Kane, Kankakee, Kendall, Lake, McHenry, and Will counties. It excludes Kenosha County in Wisconsin and Lake and Porter counties in Indiana. Tim Weddle of Loyola University–Chicago produced the graphics and contributed to the data analysis. Mark Flotow of the Illinois Department of Public Health provided timely and detailed birth and death data for Cook County. Steve Murdock of Texas A&M University provided additional data.
3 Data were obtained from the 1950 to 2000 Censuses and the 1990 Modified Age-Race-Sex file (MARS) prepared by the U.S. Census Bureau. Additional data come from the 1990–99 Federal State Cooperative Population Estimates Series (FSCPE). Detailed race-based birth and death data were obtained from the National Center for Health Statistics and the Illinois Department of Public Health. It was necessary to make a number of estimates to adjust datasets to be consistent for period covered and data type. Although these estimates are subject to minor revision, the overall findings will not change significantly. A detailed summary of the methods used is available from the author.
4 W. H. Frey and R. C. DeVol, 2000, “America’s demography of the new century,” Milken Institute, Santa Monica, CA, policy brief, No. 9.


