

The following publication has been lightly reedited for spelling, grammar, and style to provide better searchability and an improved reading experience. No substantive changes impacting the data, analysis, or conclusions have been made. A PDF of the originally published version is available here.
Recent weakness in the manufacturing sector has clearly contributed to cutbacks in employment. However, manufacturing job growth has been stagnant for much of the last half century. A number of economic trends explain the shrinkage of the manufacturing sector. These include the growing importance of the service sector and productivity improvements in manufacturing, which have facilitated output growth with stable employment.
The recession that began in March 2001 is considered by many economists to have ended sometime in late 2001 or early 2002, a duration that appears to be in line with past downturns. However, when we analyze the economic data, we see that this past recession has been unlike any previous recession that the U.S. economy has experienced. Consumer spending, representing two-thirds of our economy, typically retreats during a recession as workers lose jobs and confidence drops. Although the unemployment rate rose and confidence declined during the recent recession, consumers continued to spend. In fact, in 2001 consumers bought a record number of light vehicles. If not in the consumer sector, where did the economic weakness reside during this recession? The answer, for the most part, lies in manufacturing.
Manufacturing output peaked in June 2000, ten months before the overall economy went into a recession. The declines continued for 18 months until December 2001, with output declining by 7.6% over this time. In the 15 months since the output trough, manufacturing production has increased an anemic 1.1%. This recent weakness has clearly contributed to cutbacks in employment in the manufacturing sector. However, as this Chicago Fed Letter explains, economic trends over the past half century have also played a significant role in reducing the relative number of jobs in manufacturing.
The last half-century
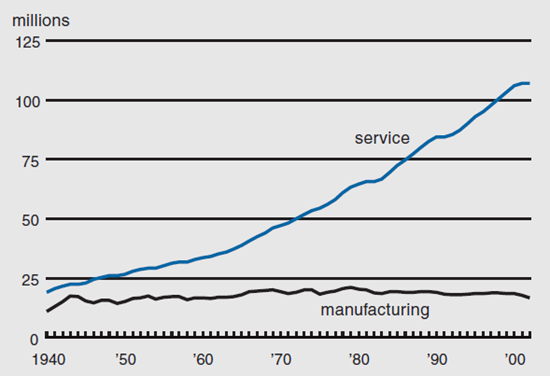
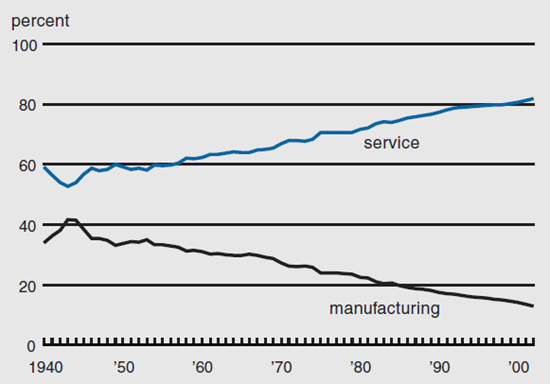
In the United States’ post World War II (WWII) economy, manufacturing employment has steadily been giving way to the rapidly rising number of service industry jobs. Just two years after WWII’s end, the necessary corrections had been made to realign the shifts in employment caused by the influx of demand for war-related goods, and service and manufacturing jobs returned to pre-WWII levels, 57.8% and 35.4% of total nonfarm employment, respectively. Over the next half-century, the number of service jobs grew 1.9% per year, while manufacturing jobs grew at a mere 0.1% annually. Figure 1 shows that in the overall scheme of things, manufacturing’s employment level has been relatively flat when put up against service industry employment, which has multiplied by 4.5 times over the past 55 years. Service job growth has pushed its share of total nonfarm employment up to an astounding 81.8% (see figure 2). On the other hand, since 1947 manufacturing’s percentage share of total employment has fallen on average 1.8% per year, leaving it today with just 12.1% of the overall employment in the U.S.
1. Nonfarm employment
2. Share of total nonfarm employment
While the growth pattern described above was evident long before the 1990s, many feared that international trade agreements introduced during that decade, such as the North American Free Trade Agreement (NAFTA) and the Uruguay Round Agreement Acts, would greatly exacerbate the manufacturing sector’s woes by creating more attractive investment opportunities away from the U.S. These fears never really panned out. In fact, during the 1990s domestic investment increased, and the U.S. was the largest recipient of foreign investment. Two countries that stand out in the recent time period are Mexico and China. Mexico’s attractiveness stems from NAFTA and its proximity to the U.S., while China’s developing economy offers relatively low wages. However, over the past two years, the capital outflow of manufacturing investment to Mexico and China was only 3% of U.S. manufacturers’ capital expenditures, which now exceed $140 billion. While many believed the attraction of low wages would cause shifts in investments, American manufacturers seem to be more concerned with skill and education levels of workers rather than wages, which are a relatively small percentage of their total costs.
Even though domestic producers have only moved a small portion of their investments outside the U.S., imports from foreign producers continue to flow through our borders in increasing numbers. Canada, Mexico, and China continue to be the import leaders for the U.S., with a combined 2002 total of $433 billion and a trade deficit of $190 billion. However, in terms of manufacturing goods the trends have not changed drastically. In fact, as figure 3 shows, there has been no real acceleration of import growth over export growth, and the two measures have moved in a similar fashion since the end of the 1990–91 recession.
3. Manufactured goods
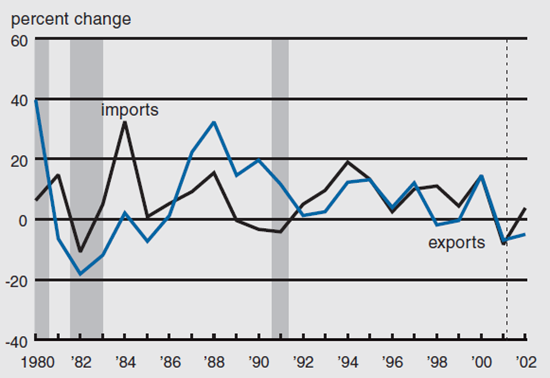
Source: U.S. Department of Commerce, Bureau of the Census, derived from Haver Analytics.
Productivity’s role in industrial production’s gains
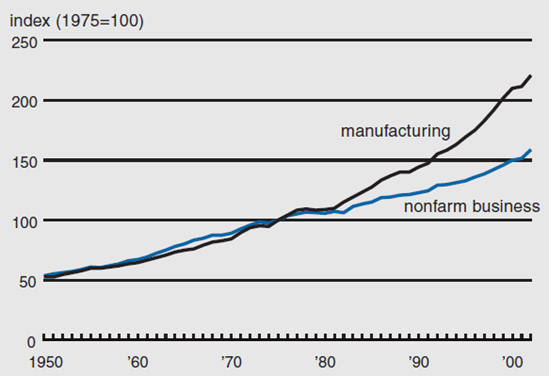
Given a somewhat constant level of employment, to what extent has the manufacturing sector’s productivity and output been changing over the same period? On the productivity side, the mid-1970s brought about a divergence in the output per hour for workers for manufacturing versus the rest of the nonfarm business sector. The personal computer and the rise of computer numerical control (CNC) led to productivity increases in manufacturing that far outweigh those seen in nonfarm business overall. Figure 4 shows that since 1975, the average annual growth rate for manufacturing productivity has been almost double the 1.7% growth witnessed in the nonfarm sector as a whole. Within manufacturing, durable goods claim a larger portion of the gains in productivity than nondurable goods, with an average growth rate of 3.7% annually versus 2.1%.
4. Productivity—output per hour for all workers
The Federal Reserve Board’s monthly Industrial Production Index shows that manufacturing output growth has averaged just over 3.6% since World War II. Given that employment has not changed dramatically, it is productivity and the amount of automated machinery used to produce the growing number of manufactured goods that have led to increases in manufacturing output growth.
Measured against the economy’s broadest measure of economic growth, gross domestic product (GDP), industrial production has actually grown slightly faster, at 3.6% compared with real GDP at 3.4%. This is further evidence that it is not any disappearance of manufacturing, but rather strong increases in productivity that are limiting demand for more workers.
Coming out of recessions
Manufacturing has made a wealth of technological advances over the past quarter-century. How has its performance, specifically its cyclical movements entering and emerging from recessions, been affected by these changes? With the exception of the latest recession, the post-WWII recessions have been similar in terms of their impact on real GDP, industrial production, and manufacturing production employment.
Industrial production tends to bottom out at the same time as, or one quarter following real GDP, while the number of production workers bottoms out one to two quarters after real GDP. On the recovery side of the recession, industrial production has typically grown faster out of a recession than GDP and production workers, although it typically loses more from peak to trough. In all, real GDP normally falls 2% from its peak and recovers its losses within two quarters of its trough. On the other hand, industrial production falls an average of 8% from its peak and recovers its losses within one year of its trough.
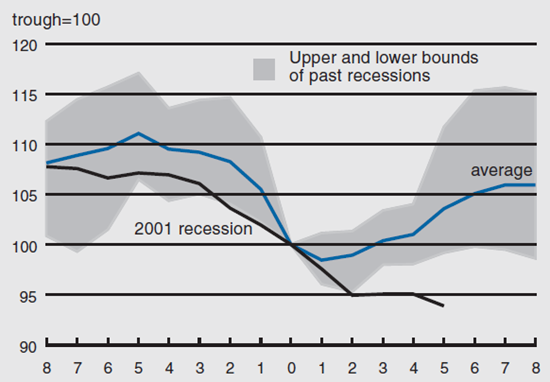
A different scenario exists for production workers and their recovery pattern. On average, they do not recover the losses in employment they suffer during recessions, at least not in the first two years of a recovery. For example, following the 1990–91 recession, it took until 1998 for manufacturing production employment to regain pre-recession levels; following the most recent recession in 2001, production employment has continued to fall, despite a recovery in GDP and flat levels of industrial production. Figure 5 shows cyclical movements in production employment indexed to the trough of real GDP, which is the third quarter of 2001 for the latest recession. The figure shows that this recovery has been the worst in the post-WWII era for manufacturing employment. Over the past ten quarters going back to the second quarter of 2000, manufacturers have shed jobs to the tune of 13%. In other post-WWII recessions, manufacturers cut an average of 11.5% of their total workers over a six-quarter span before the economy entered the recovery phase and employment began to grow again.
5. Production workers
The 1990–91 recession revealed how manufacturing productivity creates a double-edged sword in regard to employment. Employers discovered they could return production to pre-recession levels without adding workers to the payrolls.
Different recession, different recovery?
What’s different about the 2001 recession and its subsequent recovery? Is productivity limiting the need to add manufacturing jobs in the post-recession environment?
The 2001 recession was unusual in the sense that it was driven by a fall-off in producer investment rather than consumer spending. Consumers plowed through the recession, purchasing automobiles and homes at record rates over the past three years. The resilience of the American consumer shows up in the measure of final sales to domestic purchases, released with GDP by the Bureau of Economic Analysis, which outpaced the growth in the total goods produced in the U.S. throughout the periods leading up to and after the 2001 recession. This recession was primarily the result of manufacturers pulling back from unsustainably high levels of investment to increase capacity in the late 1990s.
The capacity problems are especially evident in computer and electronic products, where producers are running at a level of 60% of full capacity, compared with levels of 80% to 85% in the late 1990s. Capacity growth peaked in July 1998 at 7.8%, the highest recorded year-to-year growth ever. Capacity expansion has since subsided to 1%, the lowest level since the early 1980s. Firms are now forced to wait for output to push back up to levels that are in line with capacity before they begin any new investment.
A number of external factors not found in typical business cycles also played a role in making the most recent recession somewhat different from the past. One of these factors was the “irrational exuberance” in equity markets, particularly the NASDAQ. The markets peaked at extraordinarily high levels at the beginning of 2000, the Dow Jones in January and the NASDAQ in March (monthly averages). This was followed by three straight years of losses, during which the Dow lost 29.3% of its value and the NASDAQ an astounding 71.9%. Also, the unusually cold winter of 2000 brought about low inventories of gasoline and heating fuel, resulting in high energy prices, which have limited the amount of spending consumers could dedicate to nonenergy-related products.
Then, just as things seemed to be turning around toward the end of the summer of 2001, the September 11 terrorist attacks caused a sharp decline in travel, multiplying the problems of an already struggling airline industry. These effects rippled through to the hotel, restaurant, and car rental areas of the travel industry. While the economy struggled to absorb these shocks, the Enron bankruptcy in late 2001 generated broader concerns about corporate governance, slowing the recovery in 2002. Finally, the war in Iraq in 2003, coinciding again with high energy prices, and the ongoing war on terrorism continue to cloud the economic picture.
Conclusion
The divergence of service and manufacturing employment shares of overall employment, though alarming at first glance, does not imply the disappearance of manufacturing. Indeed, the near-zero growth rate in employment in manufacturing over the past half-century can be better explained by the American manufacturers’ success in incorporating technological advances into their processes, leading to productivity gains that are twice those witnessed in other sectors. Strong growth in industrial production reveals the double-edged sword of trading employment growth for productivity gains.
Today, the economy is recovering slowly from the extraordinary recession of 2001. With significant opportunities for investment, we expect to see a manufacturing recovery that includes a rebound in production employment. However, we do not expect manufacturing employment growth to outpace that of other industries. As the past half-century has demonstrated, productivity gains mean that it is possible to produce more with less. Still, these productivity gains have been critical in keeping production facilities in the U.S., albeit with a relative loss of manufacturing employment.


