

The following publication has been lightly reedited for spelling, grammar, and style to provide better searchability and an improved reading experience. No substantive changes impacting the data, analysis, or conclusions have been made. A PDF of the originally published version is available here.
Previous research on the importance of technology shocks in understanding the business cycle emphasized the effects of neutral technological change that affects the production of consumption and investment goods symmetrically. New research shows that investment-specific, not neutral, technological change, embodied in the investment good itself (a faster computer chip) or in the process for producing it, is a major source of the business cycle.
What drives the ups and downs in the pace of aggregate economic activity we call the business cycle? This is an enduring question with critical implications for determining the best approach to monetary and fiscal policy. The purpose of this Chicago Fed Letter is to report on new research by Fisher (2002), which suggests that shocks to the pace of technological progress may be an important factor driving business cycles.1 Previous research has emphasized the effects of neutral technological change that affects the production of consumption and investment goods symmetrically. The new research described in this article suggests that a different kind of technological progress, which is embodied solely in new investment goods, is crucial for understanding the business cycle.
Twenty years ago, most economists viewed the business cycle as being driven by “aggregate demand” shocks, arising from waves of pessimism and optimism (sometimes called “animal spirits”), or monetary and fiscal policy. Implicit in this theory is the view that business cycles are pathological and should be offset by stabilization policy. This view of business cycles was brought into question in the 1980s by a group of researchers who articulated an alternative view called real business cycle (RBC) theory. This theory says that the business cycle is driven by shocks to the rate of neutral technological change. To many economists this is an attractive theory because it suggests that the business cycle is just a part of the normal growth process. However, the theory is controversial because, at least in its purest forms, it says that any attempt to use stabilization policy would be counterproductive because it would make people worse off.
RBC theory gained a lot of adherents because an extensive body of research shows that neutral technology shocks can explain much of the fluctuations in key macroeconomic variables. This research is based on a methodology that involves specifying parametric versions of the standard growth model, assigning plausible values to the parameters in the model, and then generating data from the model by simulating it. We then judge a particular model by how well the simulated data resembles actual data. The early research was quite limited in its scope, but over time the models were extended and many of the substantive objections to the theory were overcome. Indeed, by the time of the review article by King and Rebelo (1999),2 it is fair to say that research based on simulating growth models had established that neutral technology shocks account for a significant fraction of the business cycle.
In recent years, another body of research has brought this view into doubt. This research focuses on imposing a reduced-form econometric assumption implied by many RBC models. The specific assumption is that neutral technological change is the only source of long-run changes in labor productivity. The standard methodology for evaluating RBC models involves being very specific about the nature of the mechanism by which technology shocks are propagated through the economy. One desirable feature of the reduced-form methodology is that it is consistent with any propagation mechanism that can be incorporated into an RBC model. In this sense it is more general than the typical RBC study. The reduced-form approach was used by Galí (1999)3 to show that neutral technological change accounts for very little of the business cycle variation in aggregate hours. Given the generality of the approach and the robustness of Galí’s findings, the reduced-form evidence is an important challenge to RBC theory.
The new research by Fisher (2002) shows that the Galí findings are special to his consideration of just neutral technological change and that once one considers the role of investment-specific technological change, then technology shocks seem to be important for understanding the business cycle. Beginning with Greenwood, Hercowitz, and Krusell (1997),4 researchers have used evidence on the secular decline in the real investment price to show that investment-specific, not neutral, technological change, is the major source of economic growth. This research supports the view that the Galí-style research may have ignored a potentially important source of technology-driven business cycle variation, namely that due to investment-specific technology shocks.
Figure 1 shows why investment-specific technological change may be important for growth. The dashed line is the log real price of investment goods. The real price is a producer durable equipment price deflator divided by a deflator for consumption (see Fisher, 2002, for the details on how the data described in this article were constructed). According to growth theory, this real price should be an excellent measure of investment-specific technological change over long horizons. Other things equal, an improvement in investment-specific technology (this could be embodied in the investment good itself, such as in a computer chip that runs faster than it did before, or in the process for producing new investment goods, such as in a better machine for stamping parts for a piece of capital equipment) should lower the cost of investment goods relative to other goods. Figure 1 shows that the real price fell about 200% over the period 1955–2000, which is indicative of substantial investment-specific technological progress.
1. Equipment investment in the long run
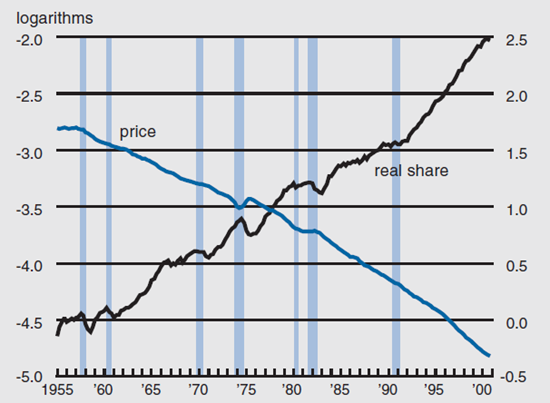
Sources: Author’s calculations based on data from the U.S. Bureau of Economic Analysis, National Income and Product Accounts, and from Cummins and Violante (2002). See Fisher (2002) for more details.
The black line in figure 1 is the log real share of investment in total output. It measures the quantity of investment goods produced in the economy relative to the total amount of production in the economy measured in consumption units. Growth theory predicts that if neutral technological progress were the only source of growth, then the real share should be stationary. As the figure indicates, there was a substantial increase in the relative quantity of investment goods produced over the period 1955–2000. This is consistent with the decline in the real price of investment goods. As investment goods have become cheaper relative to consumption goods, more of them have been produced relative to consumption goods.
The evidence in figure 1 suggests that there has been substantial investment-specific technological progress and that it has had a large impact on investment. Given that growth in part depends on the accumulation of capital, this is suggestive of an important role for investment-specific technological change for growth. Greenwood et al. (1997) and Cummins and Violante (2002)5 have demonstrated that in fact the contribution to growth in per capita output of investment-specific technological change is large—about 60% of output growth can be attributed to this kind of technological change. This is an important finding because the commonly held view used to be that neutral technological change was the main source of growth.
From the RBC perspective, if investment-specific technological change is important for growth, it could also be important for business cycles. Figure 2 presents data that is suggestive of this being the case. This figure displays real equipment investment and its real price after detrending, so that it shows only fluctuations associated with the business cycle. The striking feature of this figure is that investment and its price tend to move in opposite directions. This is what one should expect if supply shocks are driving investment. An obvious possible source of these supply shocks is variation in the rate of investment-specific technological change.
2. Equipment investment over the business cycle
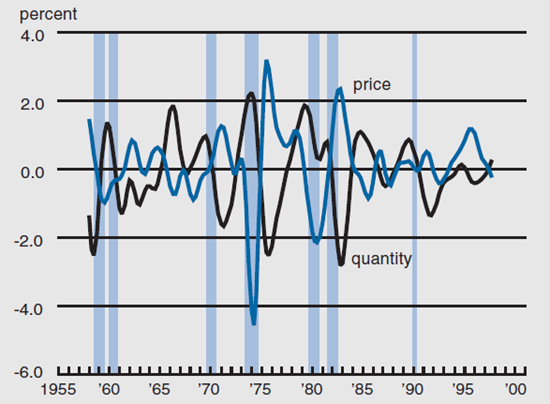
Sources: Author’s calculations based on data from the U.S. Bureau of Economic Analysis, National Income and Product Accounts, and from Cummins and Violante (2002). See Fisher (2002) for more details.
These considerations are suggestive of a key role for investment-specific technological change in driving business cycles. Fisher (2002) assesses this possibility by making two changes to the assumptions used by Galí to estimate the effects of technology shocks. First, the assumption that neutral technological change is the only source of long-run changes in labor productivity is modified to include the possibility that investment-specific change also has an effect.
Second, investment-specific technological change is assumed to be the unique source of the secular trend in the real price of investment goods. Fisher (2002) argues that these assumptions are consistent with the predictions of growth theory and that they are sufficient to identify the effects of both kinds of technological change.
I now discuss one particular set of results from Fisher (2002) to give a flavor of that paper’s main findings. These results are based on estimating a vector autoregression including growth in the real investment price, growth in labor productivity, and the log level of per-capita hours worked and applying the two assumptions described above to identify neutral and investment-specific shocks. Figure 3 suggests that the identified shocks make sense from the perspective of theory. This figure displays point estimates of the percentage responses of the real equipment price, labor productivity, and per capita hours worked to both kinds of technology shock. The positive response of productivity to a neutral shock in panel B is what defines this shock. That hours respond positively to this shock is consistent with standard RBC models. Interestingly, the investment price rises (its inverse falls) after a positive neutral shock. This is what one would expect in an RBC model with a rising short-run supply price of capital, such as in the two-sector model in Christiano and Fisher (1998).6
3. Dynamic responses to technology shocks
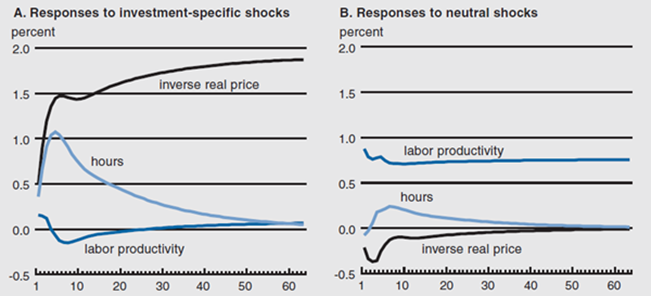
The responses to investment-specific shocks in panel A are conditional on the permanent and positive response of the inverse equipment price. The positive response of hours is consistent with the RBC models studied by Christiano and Fisher (1998) and Greenwood, Hercowitz, and Krusell (2000).7 The peak response of hours is four times greater than the response of hours to a neutral shock. After an initial increase, productivity declines below zero before rising to its long-run positive value. The short-run decline in productivity is also reasonable from the perspective of theory, because investment takes time to have an impact on the capital stock and so productivity can be driven by hours in the short run if the hours measure responds strongly.
The responses of hours are broadly consistent with theory, but are they of the kind that can account for observed hours?
The weak response of hours to a neutral shock is suggestive that this kind of shock is unimportant for explaining the business cycle. On the other hand, the strong response of hours to an investment-specific shock suggests this shock may be important. Figure 4 illustrates the contribution of the two shocks to the business cycle. It shows historical decompositions of hours due to investment-specific, neutral, and both technology shocks, along with the actual path of hours. Panel A shows the investment-specific shock accounts for a large part of the variation in hours, particularly around recessions. In striking contrast, neutral technology shocks (panel B) seem almost unrelated to the business cycle. The combined effects of the two shocks (panel C) track actual hours quite closely.
4. Actual and technology-driven aggregate hours
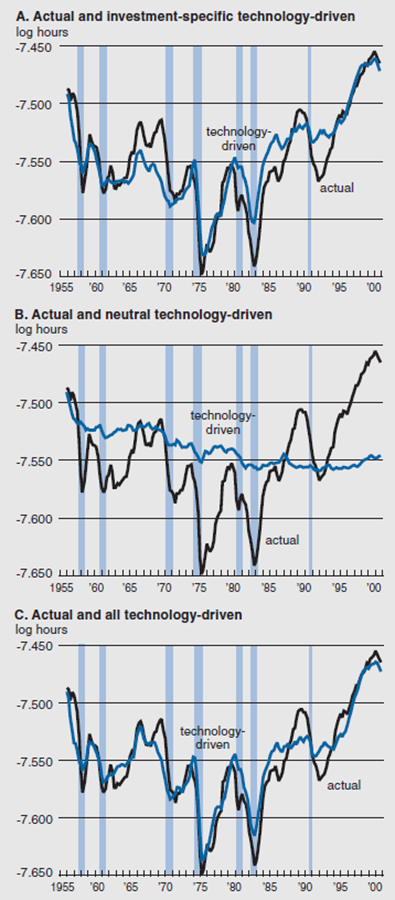
Sources: Author’s calculations based on data from the U.S. Bureau of Economic Analysis, National Income and Product Accounts, from the U.S. Bureau of Labor Statistics, and from Cummins and Violante (2002). See Fisher (2002) for more details.
Fisher (2002) reports that when the same detrending procedure applied in figure 2 is applied to hours and the components of hours driven by the technology shocks shown in figure 4, then a bit more than 50% of the variation in hours can be attributed to investment-specific shocks but less than 5% can be attributed to the neutral shocks. The implication seems clear: Technology shocks are important for the business cycle and investment-specific shocks are the most important of the technology shocks considered.
Fisher (2002) shows that these results are quite robust. Therefore, the results strongly suggest that technology shocks are important for understanding business cycles. This is an important finding, because it suggests that the RBC hypothesis is very much alive. However, the traditional focus of RBC research on neutral technology shocks does not seem right. The results suggest that future research could benefit from being directed toward studying investment-specific technological change.
Notes
1 J. Fisher, 2002, “Technology shocks matter,” Federal Reserve Bank of Chicago, working paper, No. 2002-14.
2 R. King and S. Rebelo, 1999, “Resuscitating real business cycles,” in Handbook of Macroeconomics, Michael Woodfood and John Taylor (eds.), Amsterdam: North-Holland.
3 J. Galí, 1999, “Technology, employment, and the business cycle: Do technology shocks explain aggregate fluctuations?” American Economic Review, Vol. 89, March, pp. 249–271.
4 J. Greenwood, Z. Hercowitz, and P. Krusell, 1997, “Long-run implications of investment-specific technological change,” American Economic Review, Vol. 87, June, pp. 342–362.
5 J. Cummins and G. Violante, 2002, “Investment-specific technical change in the United States (1947–2000): Measurement and macroeconomic consequences,” Review of Economic Dynamics, Vol. 5, No. 2, April, pp. 243–284.
6 L. Christiano and J. Fisher, 1998, “Stock market and investment good prices: Implications for macroeconomics,” Federal Reserve Bank of Chicago, working paper, No. 98-6.
7 J. Greenwood, Z. Hercowitz, and P. Krusell, 2000, “The role of investment-specific technological change in the business cycle,” European Economic Review, Vol. 44, No. 1, pp. 91–115.


