

The following publication has been lightly reedited for spelling, grammar, and style to provide better searchability and an improved reading experience. No substantive changes impacting the data, analysis, or conclusions have been made. A PDF of the originally published version is available here.
Exports of U.S.-made auto parts have stalled in recent years, while import levels of auto parts have continued to increase. The authors detail the magnitude and destination of U.S. imports and exports of specific auto parts in order to assess the challenges facing U.S. parts suppliers.
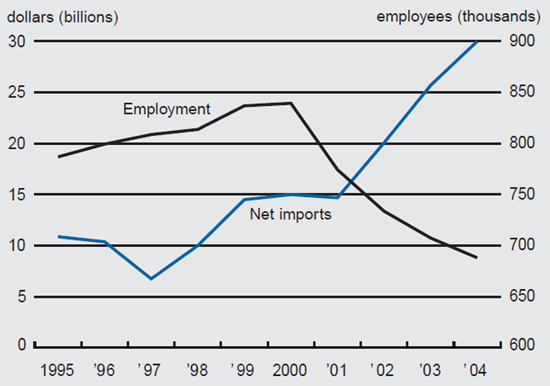
While U.S. auto parts suppliers employ over three times as many people as the vehicle assembly sector, auto parts employment continues to trend downward as import levels continue to swell (see figure 1).1 The market share of the Big Three U.S. vehicle producers has fallen steadily from 73% in 1996 to under 52.2% in October 2005. In turn, vehicle imports and U.S.-based production of foreign nameplates has grown substantially, picking up 8 and 7 percentage points of market share, respectively, since 1995. This has resulted in a changed customer mix for many supplier companies. With continued strong growth in parts imports, U.S. parts makers are facing calls by automakers to accelerate and pass on cost savings in parts production. In this Chicago Fed Letter, we examine trends in the trade of motor vehicle parts. We detail the magnitude of U.S. imports and exports of auto parts, the specific types of parts being traded, and the countries of origin and destination. Finally, we identify challenges for U.S. parts suppliers in the years ahead.
1. Auto parts—net imports and employment
Traded parts
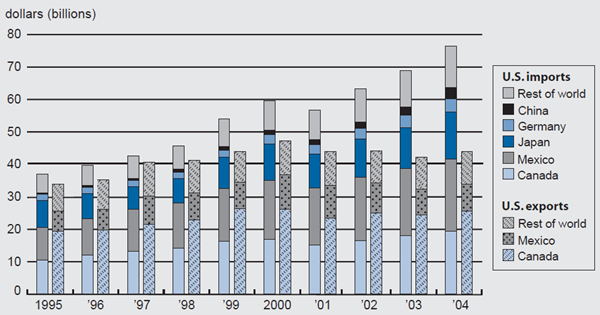
The U.S. imported $77 billion of motor vehicle parts in 2004, according to data provided by the U.S. International Trade Commission.2 In 2002, these imports accounted for 27% of all shipments of vehicle components in the U.S.3 The nominal value of imported motor vehicle parts more than doubled during the past decade, from $37 billion in 1995 to $77 billion in 2004 (see figure 2). Imports exceeded $40 billion in 1997, $50 billion in 1999, and $60 billion in 2002. Exports increased from $34 billion in 1995 to a historical peak of $47 billion in 2000. Through most of the 1990s, exports of motor vehicle parts were roughly equivalent to imports. Both imports and exports of parts declined by $3 billion in 2001, in the wake of the September 11 attacks. Imports resumed their rapid growth the following year, but exports stagnated at $40-some billion per year. As a result, a substantial trade deficit in motor vehicle parts emerged in the U.S. in the early years of the twenty-first century.
2. Auto parts trade by major countries
Which parts are imported?
To summarize the trade data, we first aggregate the parts information into five major systems—engine, drivetrain, chassis, body, and interior. Within these, we identify subgroups requiring different skill levels to manufacture. While some auto parts imports are price-sensitive generic parts from low-wage countries, a large share of imports to U.S. final assembly plants is made up of engines and transmissions produced by high-skilled workers in developed countries like Canada and Japan.
Engine-related components (including complete engines, as well as engine parts, air and fluid handling, and electrical parts) are most heavily represented in imports, by a wide margin. This category accounted for $23 billion of the $77 billion in imports in 2004 (see figure 3). Among the engine-related subsystems, two components at opposite ends of the skills spectrum together accounted for more than one-half of these imports (and one-sixth of all auto parts imports). At the highly skilled end, the single highest-value category was complete engines. Vehicles assembled in the U.S. contained $6 billion worth of imported engines in 2004, an increase from $2 billion a decade earlier. Imports from Canada were responsible for nearly half of the increase in the decade, and imports from Mexico, Japan, and Germany for most of the other half. U.S. assembly plants installed about 500,000 engines manufactured in Canada and 250,000 from each of the following countries: Mexico, Japan, and Germany.
3. Auto parts trade by system, 2004
| Imports | Exports | |||
| System | Value | Percent of total |
Value | Percent of total |
| ($bil.) | ($bil.) | |||
| Engine | 23 | 31 | 10 | 23 |
| Air & fuel handling | 4 | 6 | 2 | 4 |
| Complete engine | 6 | 8 | 4 | 9 |
| Electrical | 8 | 11 | 2 | 4 |
| Engine parts | 5 | 6 | 2 | 6 |
| Body | 12 | 15 | 11 | 24 |
| Chassis | 15 | 19 | 8 | 17 |
| Drivetrain | 10 | 13 | 4 | 8 |
| Interior | 10 | 13 | 3 | 6 |
| Other | 7 | 9 | 9 | 21 |
| Total | 77 | 100 | 44 | 100 |
Sources: Authors’ calculations and U.S. International Trade Commission.
At the least-skilled end was electrical wiring; 80% of wiring imports originate in Mexico, which emerged as the leading producer of wiring harnesses in the 1970s. Relatively labor-intensive and easy to ship, wiring was the first major component to be imported in large numbers.
Imports in chassis, at $15 billion the largest of the remaining systems, have made the greatest percentage gains since 1990. The chassis has become the principal “battleground” system between domestic and imported sources. Engineering advances have transformed chassis modules from high-cost production items requiring skilled labor to low-cost “generic” items highly sensitive to labor cost savings. Among major chassis components, brakes and tires had the highest levels of imports, $4 billion each in 2004. Steering, suspension, and wheels each contributed about $2 billion to the import total. Between 1995 and 2004, the level of imports quadrupled for wheels, tripled for steering and suspension components, and doubled for brakes and tires.
National origin of imports
Canada, Japan, and Mexico were the countries of origin for 72% of the parts imported into the U.S. in 2004 (see figure 2), totaling $22 billion from Mexico, $19 billion from Canada, and $14 billion from Japan. The same three countries had accounted for 78% of total imports just a decade earlier. Mexico passed Canada as the leading source of imports for the first time in 1999.
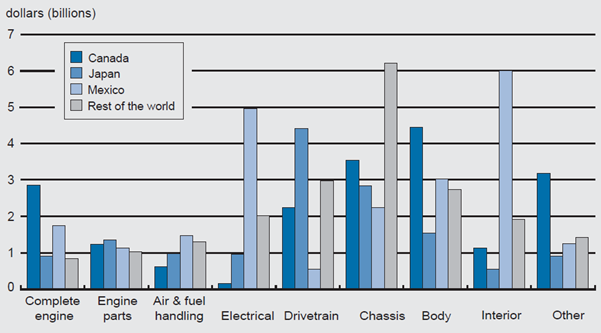
Canada, Japan, and Mexico have all been major exporters of engine components to the U.S. but differ in the other systems they export (see figure 4). Canada has been the leading source of body and chassis components, as well as of assembled engines. Body and chassis components are bulky metal structures that have traditionally been built close to final assembly plants. Japan has been the leading exporter of drivetrain components and a close second to Canada in chassis components. Japanese drivetrain exporters are closely tied to Japanese carmakers in the U.S. through keiretsu relationships.4 Mexico has been the dominant source of electrical and interior components, such as wiring harnesses and seat parts, which are especially sensitive to labor costs.
4. Auto parts imports by system and country of origin, 2004
Which parts are exported?
Imports and exports increased at the same rate during the 1990s. That trend was broken in 2000. Exports have stagnated since then, while imports have continued to accelerate. Two countries, Canada and Mexico, are on the receiving end of over three-quarters of U.S. auto parts exports. During the first half of 2005, Canada received 60% and Mexico received 17%—virtually the same percentages as a decade earlier. However, since 2000 the levels of motor vehicle parts exports from the U.S. to these two countries have declined, reflecting market share losses by the Big Three.
Canada and Mexico play such a dominant role in U.S. exports because final assembly plants in Canada and Mexico are essentially the only markets for original equipment parts made in the U.S. In particular, most U.S. exports of chassis, engine, and drivetrain components, as well as body stampings, are destined for Canadian assembly plants, mostly Big Three facilities.
The China factor
China’s contribution to the U.S. parts market in the early years of the twenty-first century can be seen in two ways. On the one hand, China’s role barely registered in the statistical tables: Only 5% of all U.S. auto parts imports (2% of the total U.S. market) in 2004 came from China. So, China’s impressive annual growth rate of 58% between 1995 and 2004 started from a very low base. Still, by June 2005 China had moved past Germany to become the fourth largest source of auto parts imports for the U.S. In analyzing the underlying detail of what is imported from China, we find that the rapid increase was overwhelmingly in aftermarket parts (sold to retailers not manufacturers) rather than original equipment. For example, 29% of all imports from China during the first half of 2005 were wheels and tires. China passed Canada as the leading source of wheels in 2002 and has expanded its share of the market since then. Producers of aftermarket parts face more pressure to minimize price than to maximize quality.
Balanced against the statistical record and constraints of geography is a universal expectation that China will play a major role in all facets of the world’s motor vehicle industry, including original equipment parts production. There is strong anecdotal evidence to suggest that original equipment parts could be imported from China in increasing volumes going forward. In 2004, GM imported 124,000 2.4-liter V-6 engines from Shanghai to the U.S. for its Equinox sport utility vehicles. In 2005, Toyota imported 25,000 2.4-liter engines to Japan from a joint venture with Guangzhou Automobile Group called Guangqi Toyota Engine Co.5 Looking ahead, GM recently announced that it “expects to increase its original equipment parts purchases from China twentyfold in six years—from $200 million in 2003 to $4 billion in 2009—while spending around $5 billion on sourcing for its China production.”6 A number of U.S. original equipment parts supplier companies have also begun setting up shop in China. Often these forays into a new market are undertaken jointly with a local partner to meet local demand in the fast-growing Chinese auto sector. But future production for export to the U.S., as well as other countries, might well be part of the business plan for some.
Conclusion
Auto parts production (like final vehicle assembly) is highly integrated across North America: In 2004, 55% of U.S. auto parts imports came from Mexico and Canada and over three-quarters of U.S. auto parts exports were headed for these two countries. But cost pressures are reshaping the global footprint of auto parts sourcing. Since 2001, U.S. auto parts exports have been flat; whereas, imports have continued to grow at a fast clip. Going forward, some of this import growth may abate as U.S.-based vehicle production by foreign producers increases and U.S.-based parts sourcing subsequently substitutes for imports. At the same time, the observed leveling off of exports of auto parts to Canada and Mexico appears to be related to the ongoing decline in Big Three market share.
Notes
1 The August 2005 payroll survey by the U.S. Bureau of Labor Statistics reports 209,000 motor vehicle assembly and 660,000 motor vehicle parts production jobs in the U.S.
2 We report data for 166 individual imported (and 120 exported) parts defined at the 10-digit level within the Harmonized Tariff Schedule of the United States (HTS) trade data. To do this, we screened the relevant HTS classification chapters to measure parts that go into the assembly of light vehicles. Our analysis of the U.S. International Trade Commission’s data closely resembles that of the Office of Aerospace and Automotive Industries’ Automotive Team, part of the U.S. Department of Commerce’s International Trade Administration. That team’s numbers refer to a more broadly defined list of parts that includes truck and bus parts and can be found at http://ita.doc.gov/td/auto/pdata.html.
3 As both trade and shipments data combine original equipment, i.e., parts destined for the assembly of new vehicles, with aftermarket parts, i.e., replacement and maintenance parts, it is not possible to determine the precise amount of each.
4 Keiretsu is a Japanese term for a set of companies with interlocking business relationships and shareholdings.
5 The plant had an annual capacity of 300,000 engines—two-thirds were expected to be exported, some to the U.S.
6 Crain Communications, Inc., 2005, “Global suppliers in China: Suppliers feel bite of market slowdown,” 2005 Guide to China’s Auto Market, May, p. 25.


