Detroit Economic Growth Increased Slightly in December, Finishing 2019 Above Its Long-Run Trend, According to Chicago Fed Index
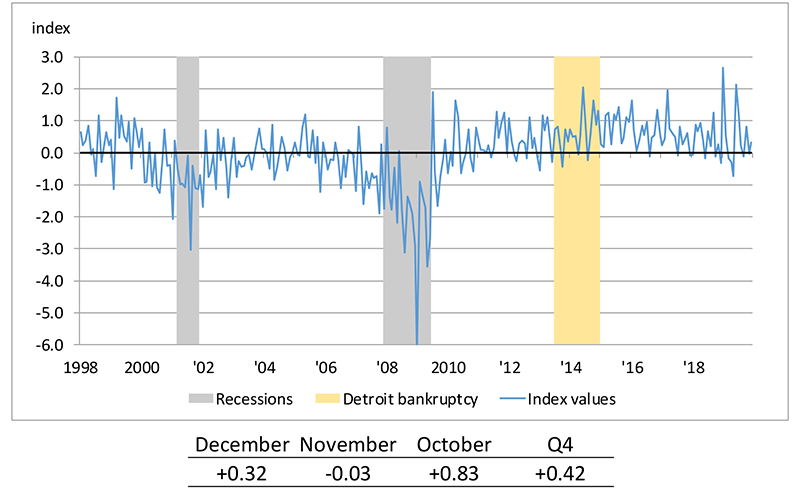
The Chicago Fed’s Detroit Economic Activity Index (DEAI) was +0.32 in December—a little below its quarterly value of +0.42 for the fourth quarter of 2019. In 2019, each quarterly value of the DEAI was above zero, implying that the city’s quarterly growth rate managed to stay above its long-run trend throughout the year. Moreover, the DEAI’s annual value was +0.77 for 2019—higher than its annual value of +0.68 for 2018.1 An index value greater than zero points to the city of Detroit’s economic activity growing faster than trend, while an index value less than zero points to the city’s economic activity growing slower than trend. The complete history of the index through December 2019 is shown below (chart 1). Detroit’s economic growth started out strong in the final quarter of 2019, with a high monthly DEAI value in October (+0.83), but it fell slightly below trend in November (–0.03) before rebounding somewhat in December (+0.32). That said, chart 1 shows how the monthly index’s volatility declined during the fourth quarter of 2019 relative to earlier parts of the year.
Chart 1. Detroit Economic Activity Index (standard deviations from trend)
To explain in more detail what transpired in late 2019, I present in table 1 the contribution to the DEAI from each of the index’s four major categories (income, labor, real estate, and trade), as well as the contributions of the monthly series making the largest contributions (positive or negative) under each category.
The income category made a contribution of –0.01 to the DEAI in December, which was almost exclusively due to a decline in the seasonally adjusted DTE residential customer counts (mostly in areas located away from the city’s downtown).
The labor category made the largest contribution (+0.34) to the DEAI in December. The positive contribution from employment growth more than offset the negative contribution from unemployment. According to data from the U.S. Bureau of Labor Statistics, employment increased in December from November, but the labor force grew faster than employment, implying that the number of unemployed persons increased. I previously discussed this in my December 5, 2019, blog entry covering the September 2019 DEAI results. In that entry, I pointed out that a growing labor force is a positive sign, even if it results in higher unemployment. An expanding labor force suggests that workers feel more encouraged about their prospects for finding work and are therefore willing to (re)enter the labor force in search of a job.2
Real estate’s negative contribution to the DEAI in December was chiefly due to decreasing single-family home prices, which were partially offset by increasing condo prices. At $42,848 in December, the median single-family home price moved down 3.2% from November on a seasonally adjusted basis. In contrast, at $222,981 in December, the median condo price moved up 3.4% from the previous month on a seasonally adjusted basis.
Trade’s contribution to the DEAI in December was negligible, as the contribution from exports (+0.02) was completely offset by the contribution from imports (–0.02).3 In the most recent data for December 2019, exports rose by 2.2%, while imports declined by 2.4%, on a seasonally adjusted basis relative to November.
Table 1. Contributions to the Detroit Economic Activity Index
| December 2019 | November 2019 | Change from November to December | |
|---|---|---|---|
| Income | –0.01 | +0.04 | –0.05 |
| – DTE residential customer count | –0.02 | +0.04 | –0.06 |
| Labor | +0.34 | –0.23 | +0.57 |
| – Employment | +0.53 | –0.04 | +0.57 |
| – Unemployment | –0.19 | –0.19 | 0.00 |
| Real estate | –0.01 | +0.16 | –0.17 |
| – Median home price | –0.02 | +0.17 | –0.19 |
| – Median condo price | +0.01 | +0.01 | 0.00 |
| Trade | 0.00 | 0.00 | 0.00 |
| – Exports | +0.02 | –0.02 | +0.04 |
| – Imports | –0.02 | +0.03 | –0.05 |
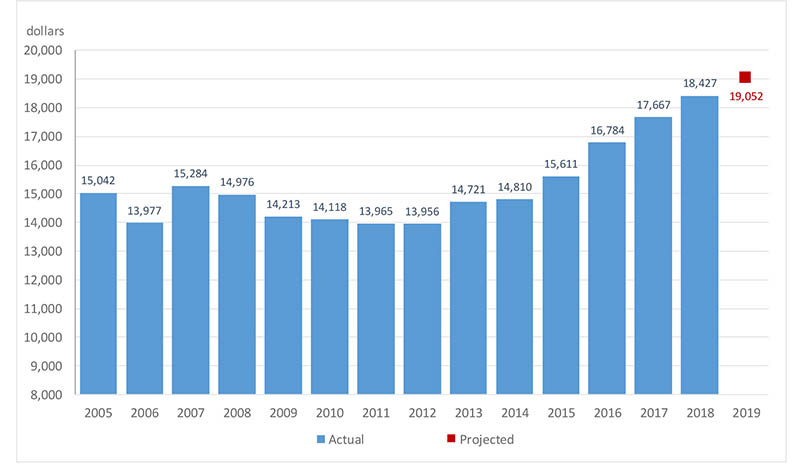
While the index itself is a useful monthly measure of economic growth for Detroit, it also allows us to project annual real per capita income (PCI)—one of the broadest measures of the city’s economic health.
Annual real per capita income data for Detroit from the U.S. Census Bureau’s American Community Survey (ACS) were released around mid-September, and the city of Detroit’s actual income level of $18,427 in 2018 was very close to the model’s estimate of $18,208, published in my September 5, 2019, blog entry on the DEAI.
Using the latest data, the model estimates that the city’s real PCI grew 3.3% on a year-over-year basis to $19,052 in 2019 (see chart 2). If this projection holds up, 2019 would mark the seventh consecutive year of positive real PCI growth.
Chart 2. Real per capita income for the city of Detroit
The March DEAI release (covering the first quarter of 2020) will be posted on June 4, 2020. The most recent DEAI results and future release dates can be found on the DEAI page of the Federal Reserve Bank of Chicago website. A copy of the December DEAI release can be found here.
Notes
1 The quarterly and annual averages we report are not “simple” averages, but instead “triangle” averages of the monthly values. For growth rate measures like the DEAI, the triangle average best approximates a quarterly or annual growth rate from a monthly growth rate. It gets its name from the tent-line nature of weights applied to current and past values in the averaging process. A simple average weights current and past values equally, while a triangle average has weights that peak in the recent past and are equally spaced going backward and forward in time from the peak.
2 The labor-related values referenced in this paragraph have all been seasonally adjusted, and they have also been adjusted for breaks in their time series resulting from the decennial censuses.
3 The trade-related data values referenced in this paragraph were inflation- and seasonally adjusted.


