District Housing Update
The housing sector has made halting progress throughout the five-year recovery from the Great Recession. Beginning in June 2013, progress began to slow as mortgage rates jumped, thereby hampering affordability and lending viability. Even as home mortgage rates and lending standards were beginning to ease, this past winter’s unusually cold and stormy weather dealt another setback to sales and construction activity in several regions, including the Midwest, Northeast, and parts of the South.
In an effort to analyze residential real estate market developments in the Seventh District, I have developed an index that monitors its metropolitan statistical areas (MSAs).1 The index combines observations of each District MSA’s housing market on a year-over-year basis. Any index value greater than 50 (indicating that more MSA observations are positive than negative) signals expansion for the Seventh District’s residential real estate sector; index values less than 50 indicate contraction.
1. Seventh District MSA housing markets index
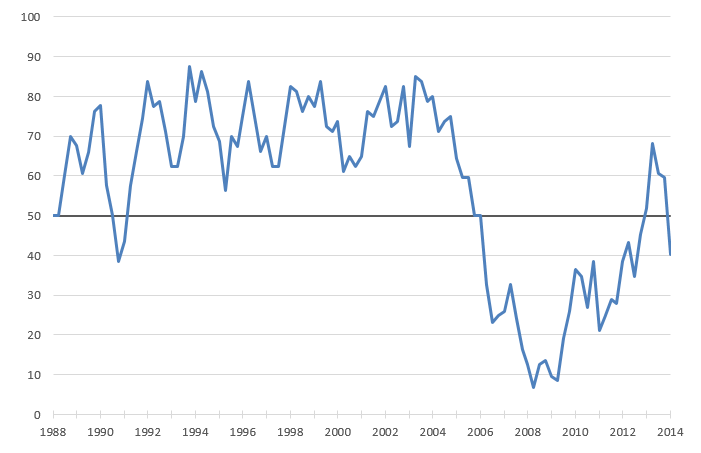
As of the first quarter of 2013, the Index entered positive (expansionary) territory for the first time since 2005, where it remained throughout 2013, although the pace of expansion eased during the second half of the year. However, the most recent reading for Q1:2014 shows that downward momentum from 2013 coupled with the depressing effect of a harsh winter pushed the index into contractionary mode once again.
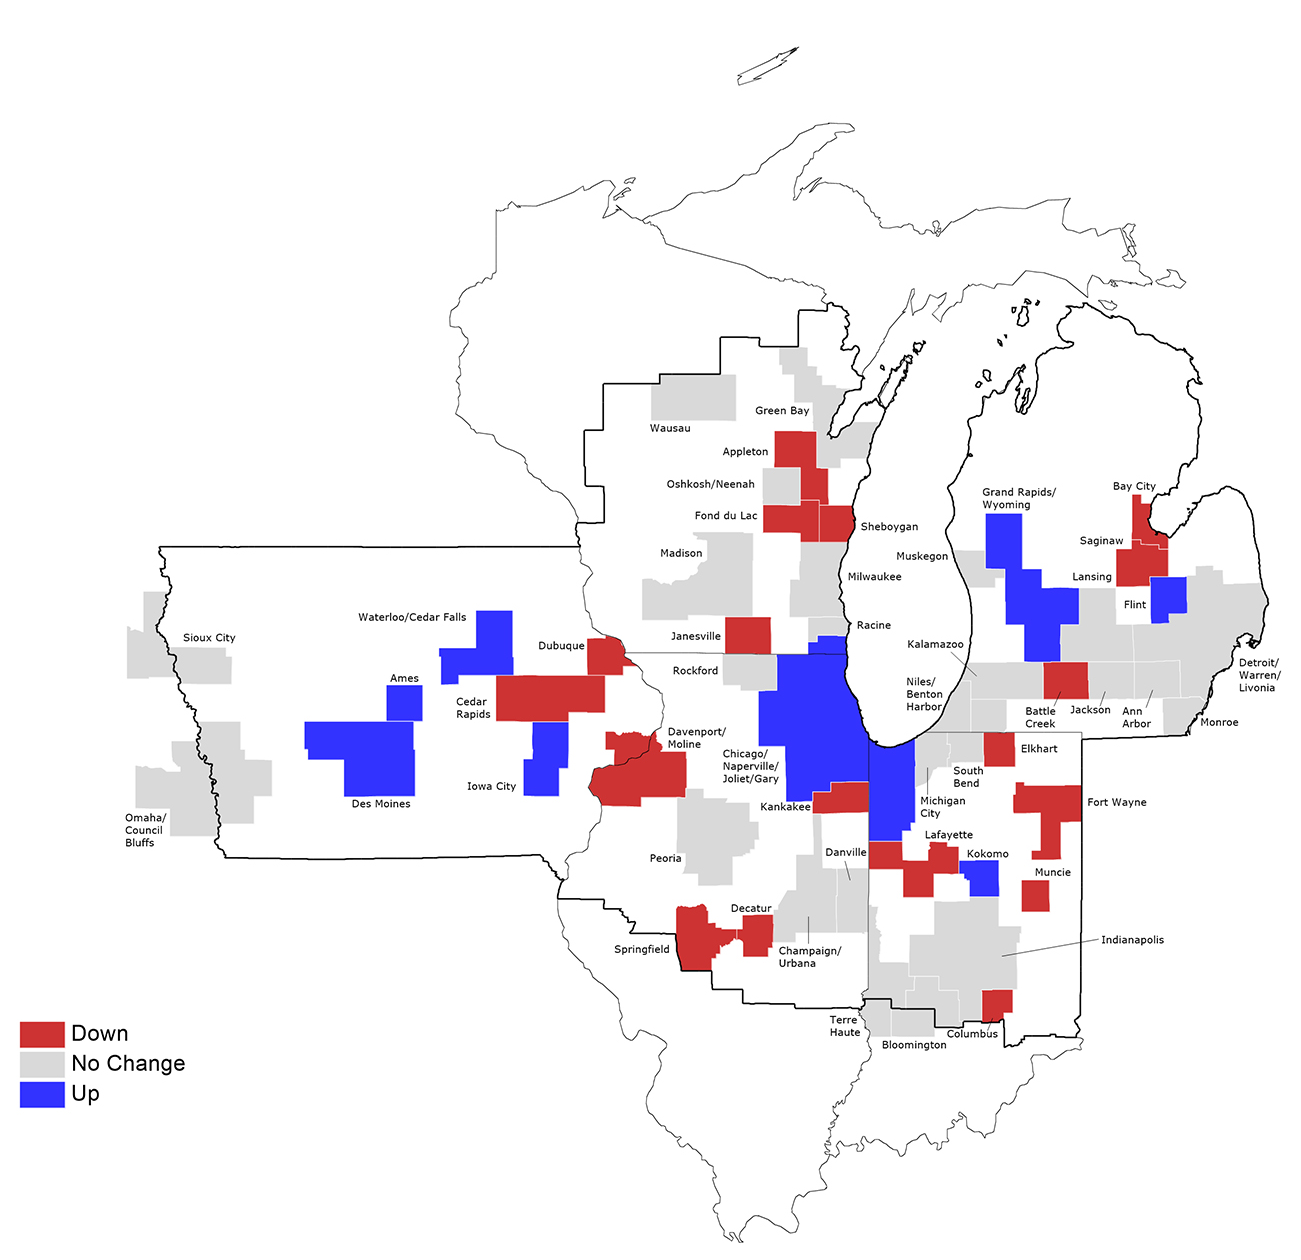
In observing individual MSAs (below), scattered contractionary trends are evident in each District state, but especially in smaller MSAs. In contrast, large MSAs continued to expand (e.g., Chicago and Des Moines) or at least showed neutral growth trends (e.g., Detroit, Indianapolis, and Milwaukee).
2. Seventh District MSA housing markets index: 2014, first quarter
3. Seventh District MSA housing markets index: 2013, fourth quarter
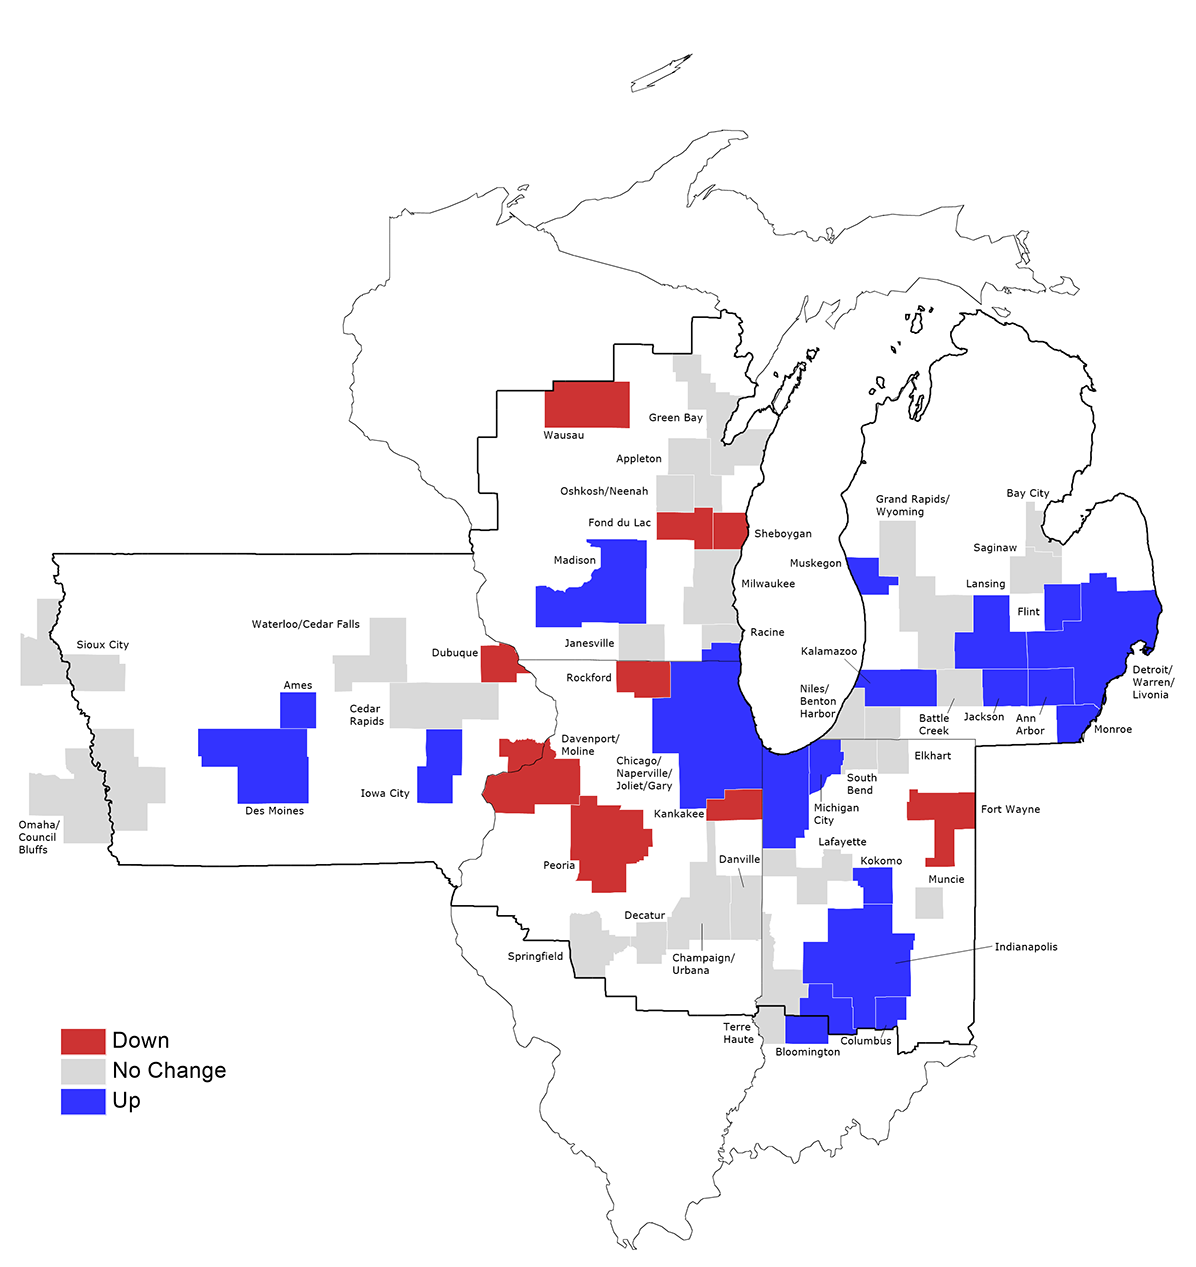
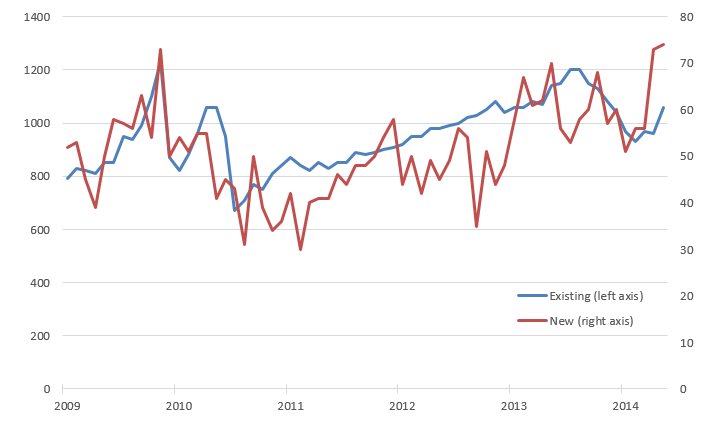
A look back to the fourth quarter of 2013 (above) shows that, to a greater extent, local housing markets continued to display improvement before the onset of winter, which raises the question of whether forward momentum will soon be reestablished. During the past couple of months, housing indicators suggest that activity has bounced back to some extent. Nationally, three major housing activity indicators—new housing sales, existing home sales, and pending home sales—have all flashed positive in May.2 Though these measures are not recorded for the particular geography of the Seventh District, all four major U.S. regions expanded by these measures in May—including the Midwest.3 Seemingly, Midwest housing is back on the road to recovery.
Still, strong activity in the second quarter of 2014 may partly reflect pent-up demand from last winter’s stall.
4. Existing and new home sales in the U.S. (thousands)
Note: thanks to Thom Walstrum for assistance.
Footnotes
1 The number of MSA observations varies slightly as MSA boundaries change and some observations must be temporarily dropped from the sample. This index is built from two distinct data measures of housing market activity in each metropolitan area. The first measure is residential building permits. Permits are obtained prior to the construction of both single-family homes and multi-family buildings, such as apartments and condos; and data on the issuance of these permits are collected on a monthly basis. The second measure is the Federal Housing Finance Agency’s House Price Index (HPI), which is a quarterly measure that tracks the movement of single-family house prices. For a discussion of methodology see this earlier blog post.
2 More information is available online here, here, and here.
3 The Midwest region consists of 12 states—Ohio, Indiana, Michigan, Illinois, Wisconsin, Minnesota, Iowa, Missouri, North Dakota, South Dakota, Nebraska, and Kansas. Though positive, growth in Midwest new home sales was weak.


