Our First Look at Job Growth in the Seventh District in 2016—New Estimates Using Early Benchmarking
Last week we received the December 2016 report from the U.S. Bureau of Labor Statistics’ (BLS) state payroll employment survey (also known as the Current Employment Statistics, or CES), so it’s our first opportunity to look at how well the Seventh Federal Reserve District1 did in 2016. The recent report is not the final word on job growth in 2016 because the data will eventually be benchmarked against more complete data, primarily those from the Quarterly Census of Employment and Wages (QCEW).2 Data for January through September 2016 will be benchmarked by the BLS in the middle of March of this year, while data for October through December 2016 will not be benchmarked by the BLS until March of next year.
In June 2015, I wrote a blog post detailing a method called early benchmarking, which predicts how the BLS will revise the CES data (the method was first introduced by our colleagues at the Dallas Fed). The BLS rebenchmarks the CES using QCEW data only once a year. However, QCEW data are released quarterly, so it’s possible to use the QCEW data to predict how the BLS will revise the CES (this process is explained in detail in my earlier post). The benchmark revisions to the CES can be quite large, and last year, I found that for the District and most District states, the early benchmarked jobs numbers were closer to the final benchmarked numbers than the non-benchmarked numbers were.
Table 1 shows that for 2016, the early benchmark procedure is predicting employment in the District grew by 106,000 rather than the 164,000 that the BLS’s current estimates indicate. This difference is largely the result of lower job growth numbers for Illinois and Wisconsin, though Iowa’s job growth number is also lower. The early benchmark procedure also suggests that Indiana’s job growth will be revised up, and Michigan’s will be unchanged.
Table 1. Nonfarm job growth in the Seventh District in 2016, by benchmark type (thousands)
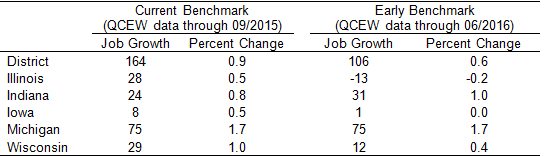
Sources: Author's calculations based on data from the U.S. Bureau of Labor Statistics, Current Employment Statistics and Quarterly Census of Employmetn and Wages, all from Haver Analytics.
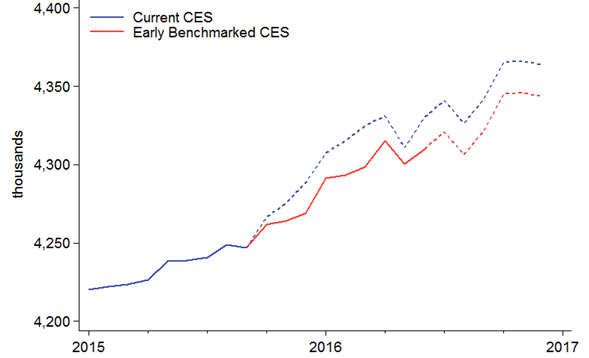
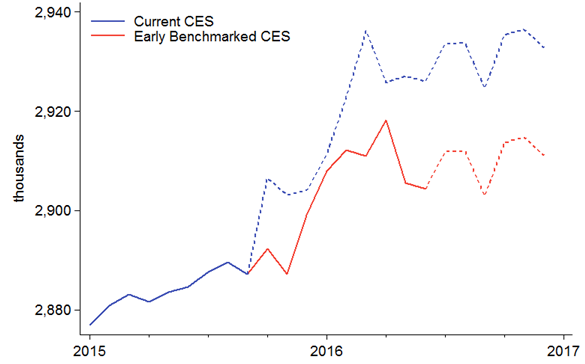
Figures 1 through 6 show the employment series as currently published by the BLS (in blue) and the early benchmarked series (in red) for the District and District states. The dashed portions of the series represent data that have not yet been benchmarked using the QCEW. The lines are identical through September 2015, but then the lines follow different paths because the early benchmarked series use growth rates from the QCEW until June 2016. While their levels differ, both series have the same growth rates starting in July 2016 (again, for more details on the early benchmarking procedure, see my earlier post).
After the BLS releases newly benchmarked data in March, I will review how well the early benchmarking procedure performed at predicting job growth in the District.
Figure 1. Seventh District employment
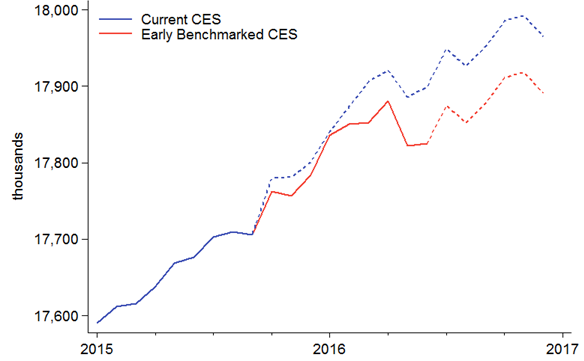
Sources: Author's calculations based on data from the U.S. Bureau of Labor Statistics, Current Employment Statistics and Quarterly Census of Employmetn and Wages, all from Haver Analytics.
Figure 2. Illinois employment
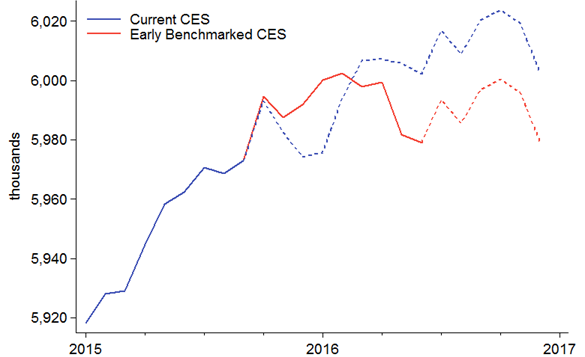
Sources: Author's calculations based on data from the U.S. Bureau of Labor Statistics, Current Employment Statistics and Quarterly Census of Employmetn and Wages, all from Haver Analytics.
Figure 3. Indiana employment
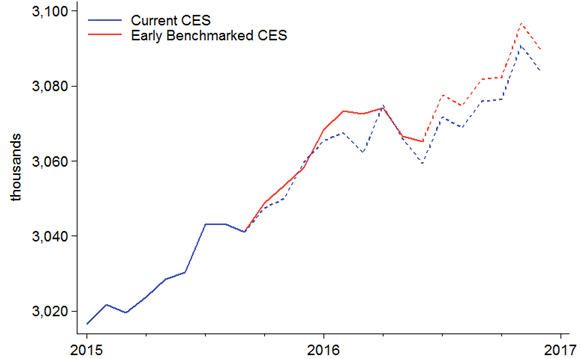
Sources: Author's calculations based on data from the U.S. Bureau of Labor Statistics, Current Employment Statistics and Quarterly Census of Employmetn and Wages, all from Haver Analytics.
Figure 4. Iowa employment
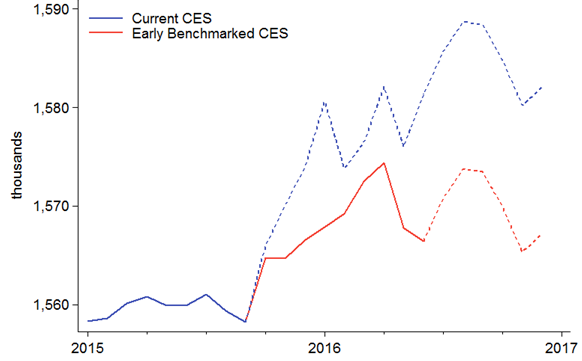
Sources: Author's calculations based on data from the U.S. Bureau of Labor Statistics, Current Employment Statistics and Quarterly Census of Employmetn and Wages, all from Haver Analytics.
Figure 5. Michigan employment
Sources: Author's calculations based on data from the U.S. Bureau of Labor Statistics, Current Employment Statistics and Quarterly Census of Employmetn and Wages, all from Haver Analytics.
Wisconsin employment
Sources: Author's calculations based on data from the U.S. Bureau of Labor Statistics, Current Employment Statistics and Quarterly Census of Employmetn and Wages, all from Haver Analytics.
Footnotes
1 The Seventh District comprises all of Iowa and most of Illinois, Indiana, Michigan, and Wisconsin.
2 For more information on the BLS’s benchmarking process, go here.


