

Greater Chatham is a 15-square-mile area in the city of Chicago that includes the largely African-American neighborhoods of Avalon Park, Auburn Gresham, Greater Grand Crossing, and Chatham. Greater Chatham is a mixed-income community with relatively high levels of human capital (figure 1). In this community, the idea that restaurants can act as an economic anchor has been the inspiration for various public and privately funded programs to support food-related businesses. Greater Chatham describes itself as the soul food/Caribbean/West African food district of Chicago. Its 75th Street “Restaurant Row” is a one-mile stretch that includes many long-time and well-known family-owned restaurants. Community leaders view restaurant corridors such as this as a source of economic strength for both restaurant owners and the surrounding community through their ability to both keep residents’ dollars in and attract visitors’ dollars to the neighborhood.1 Developing and promoting the attractions in these neighborhoods is therefore seen as a key strategy of economic development.
To inform this strategy, in this article we highlight the size of the restaurant sector in Greater Chatham, use foot traffic data to estimate the number of people who visit Greater Chatham restaurants and where those visitors travel from, and share what practitioners tell us are some challenges and opportunities for these businesses. Against a backdrop of population decline in some of the communities within Greater Chatham, we find that the number of restaurants has grown over the past decade, that restaurants in Chatham attract hundreds of thousands of visits each year, with visits steadily increasing since the pandemic, and that more than half of these visitors travel from outside Greater Chatham—mainly from Chicago’s South Side communities and the South suburbs.
1. Selected demographic and socioeconomic characteristics, 2022
| Chatham | Avalon Park | Greater Grand Crossing | Auburn Gresham | Chicago | |
| Population | |||||
| 2010 | 31,028 | 10,185 | 32,602 | 48,743 | 2,895,668 |
| 2022 | 31,382 | 9,606 | 28,991 | 46,468 | 2,721,914 |
| Population change (2010–22) | 0.01 | –0.06 | –0.11 | –0.05 | –0.06 |
| Median age of population | 41 | 44 | 39 | 38 | 35 |
| Housing | |||||
| Homeownership rate | 0.32 | 0.55 | 0.29 | 0.40 | 0.41 |
| Vacancy rate | 0.13 | 0.14 | 0.21 | 0.15 | 0.10 |
| Median home value ($) | 199,495 | 195,851 | 185,453 | 175,074 | 304,500 |
| Education | |||||
| Less than high school | 0.12 | 0.09 | 0.11 | 0.16 | 0.13 |
| HS/some college | 0.59 | 0.62 | 0.67 | 0.68 | 0.44 |
| Bachelor or more | 0.30 | 0.29 | 0.22 | 0.16 | 0.42 |
| Income | |||||
| Median Income ($) | 39,348 | 54,139 | 39,908 | 41,000 | 71,673 |
| Income less than 25K | 0.33 | 0.24 | 0.37 | 0.33 | 0.20 |
| Income 25–50K | 0.26 | 0.22 | 0.22 | 0.24 | 0.17 |
| Income 50–75K | 0.15 | 0.17 | 0.15 | 0.16 | 0.14 |
| Income 75–100K | 0.09 | 0.11 | 0.13 | 0.09 | 0.12 |
| Income 100–150K | 0.12 | 0.14 | 0.09 | 0.12 | 0.15 |
| Income greater than 150K | 0.06 | 0.12 | 0.04 | 0.07 | 0.21 |
The number of restaurants has grown over the past decade
According to census data, the number of eating establishments in zip codes in the Greater Chatham area has been on an upward trajectory, increasing from about 220 in 2012 to close to 250 businesses in 2022 (figure 2). Newer estimates from community advocates put the number closer to 300, which, unlike the Census Bureau’s counts, may include restaurants without employees.
2. Number of restaurants in Greater Chatham area
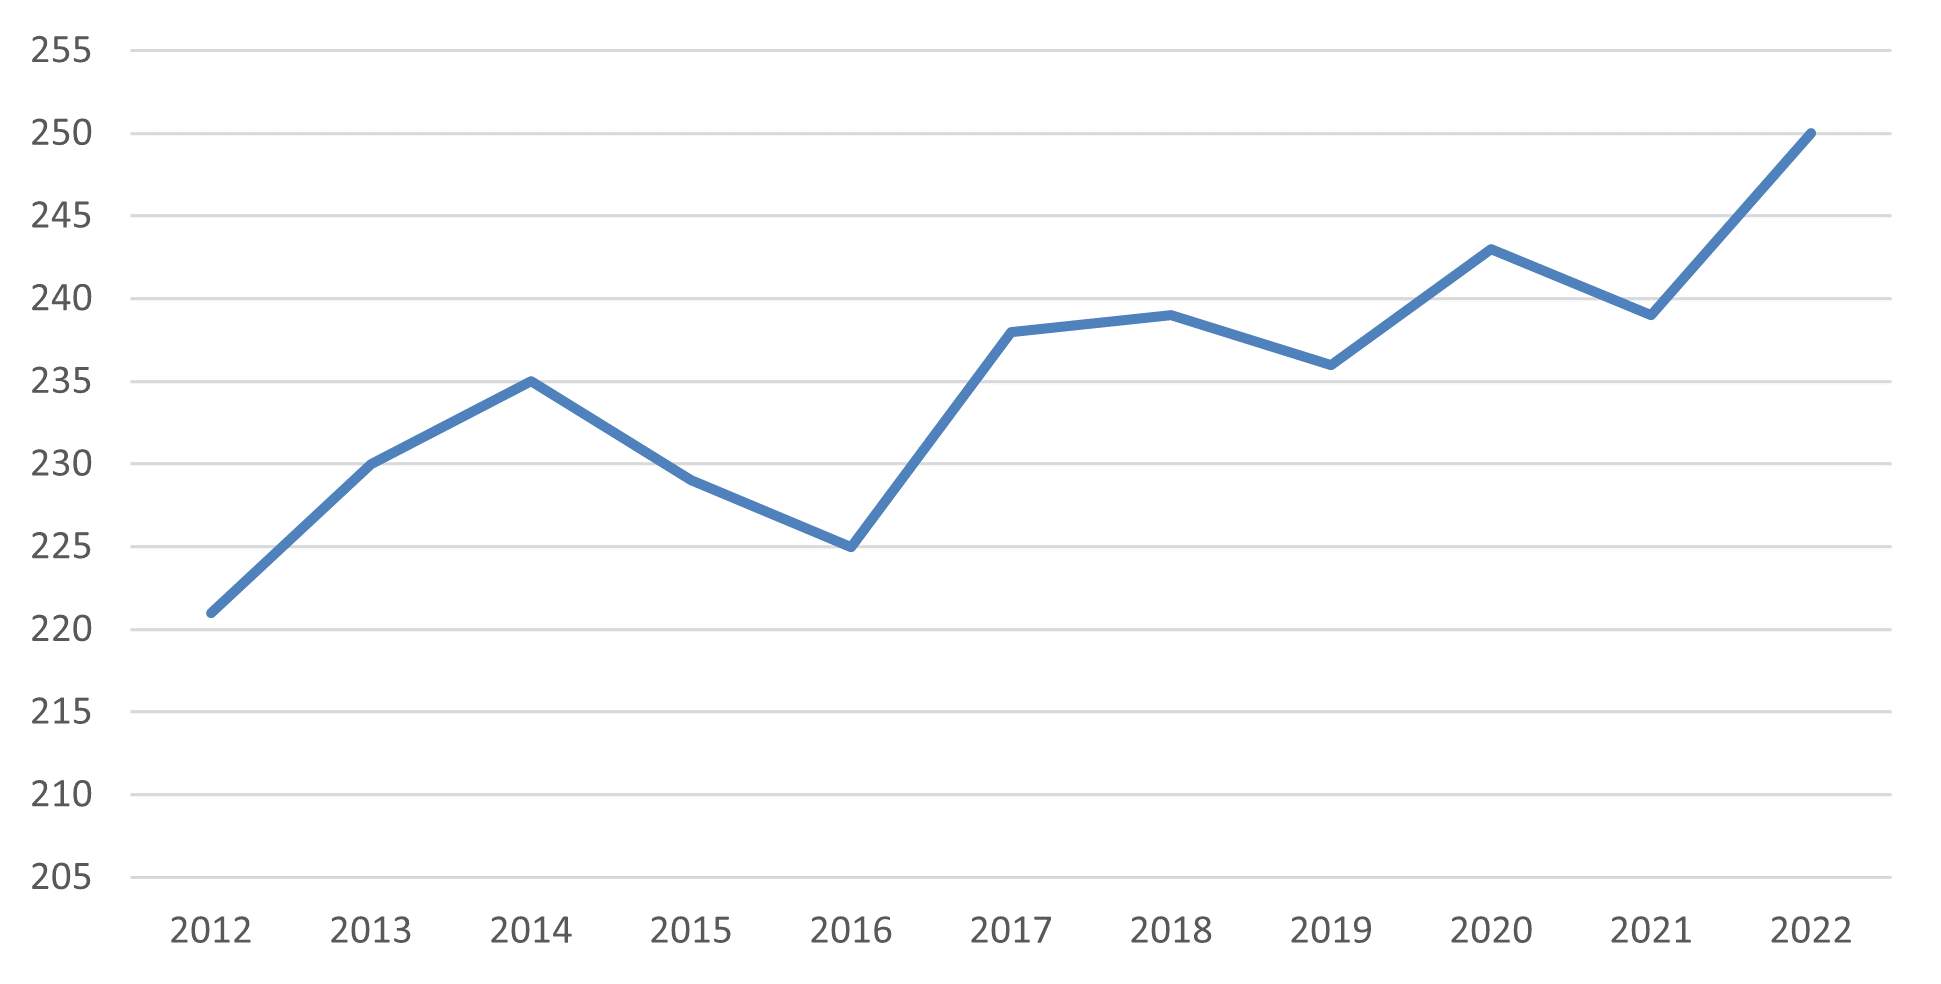
Source: U.S. Census Bureau.
A broad mix of restaurant types
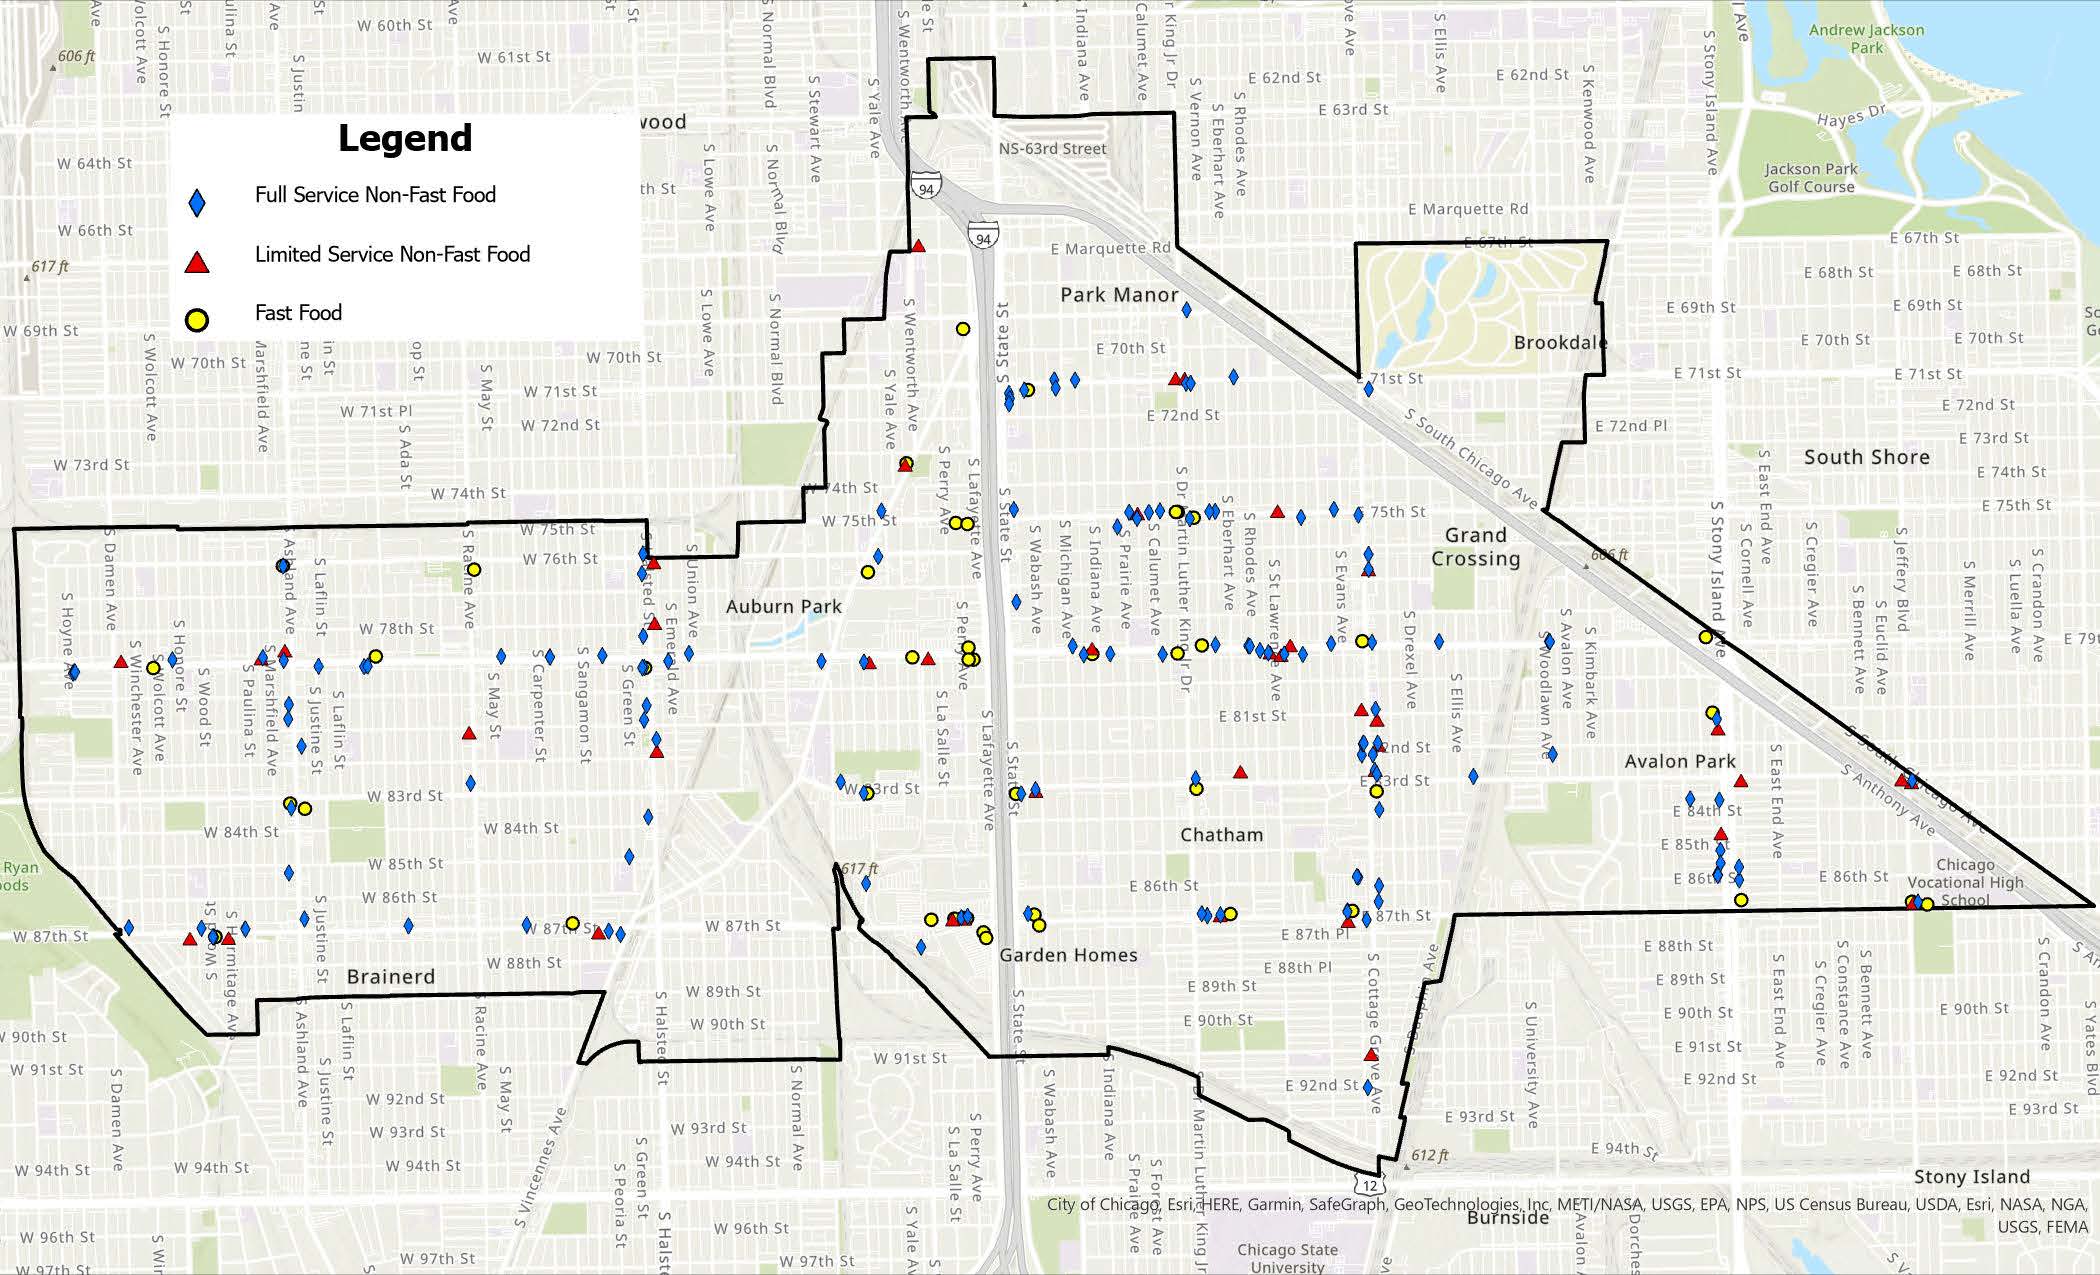
Using data from Advan Research, a mobility data vendor that provides anonymized geolocation data and industry codes for each visited site, we map the location of visited restaurants.2 We further use descriptive categories within the data to identify specific types of restaurants in the neighborhood. Figure 3 shows the diversity of restaurants, aligning with concentrations along specific streets (e.g., 75th Street). Of the more than 340 eating establishments in Greater Chatham identified by Advan Research,3 we find that 63% were “full service” and 18% were “limited service” between 2019 and 2023. In addition, 14% were fast food restaurants.4 Among limited and full-service restaurants, we also identify 35% as having a neighborhood “specialization,” based on data descriptions of restaurant types and our own internet search of Southern-, Caribbean- or Creole-focused menus, as well as restaurants that are long-standing independently owned establishments.
3. Restaurant location in Greater Chatham, 2023
Millions of foot traffic visits to restaurants in Greater Chatham around the pandemic
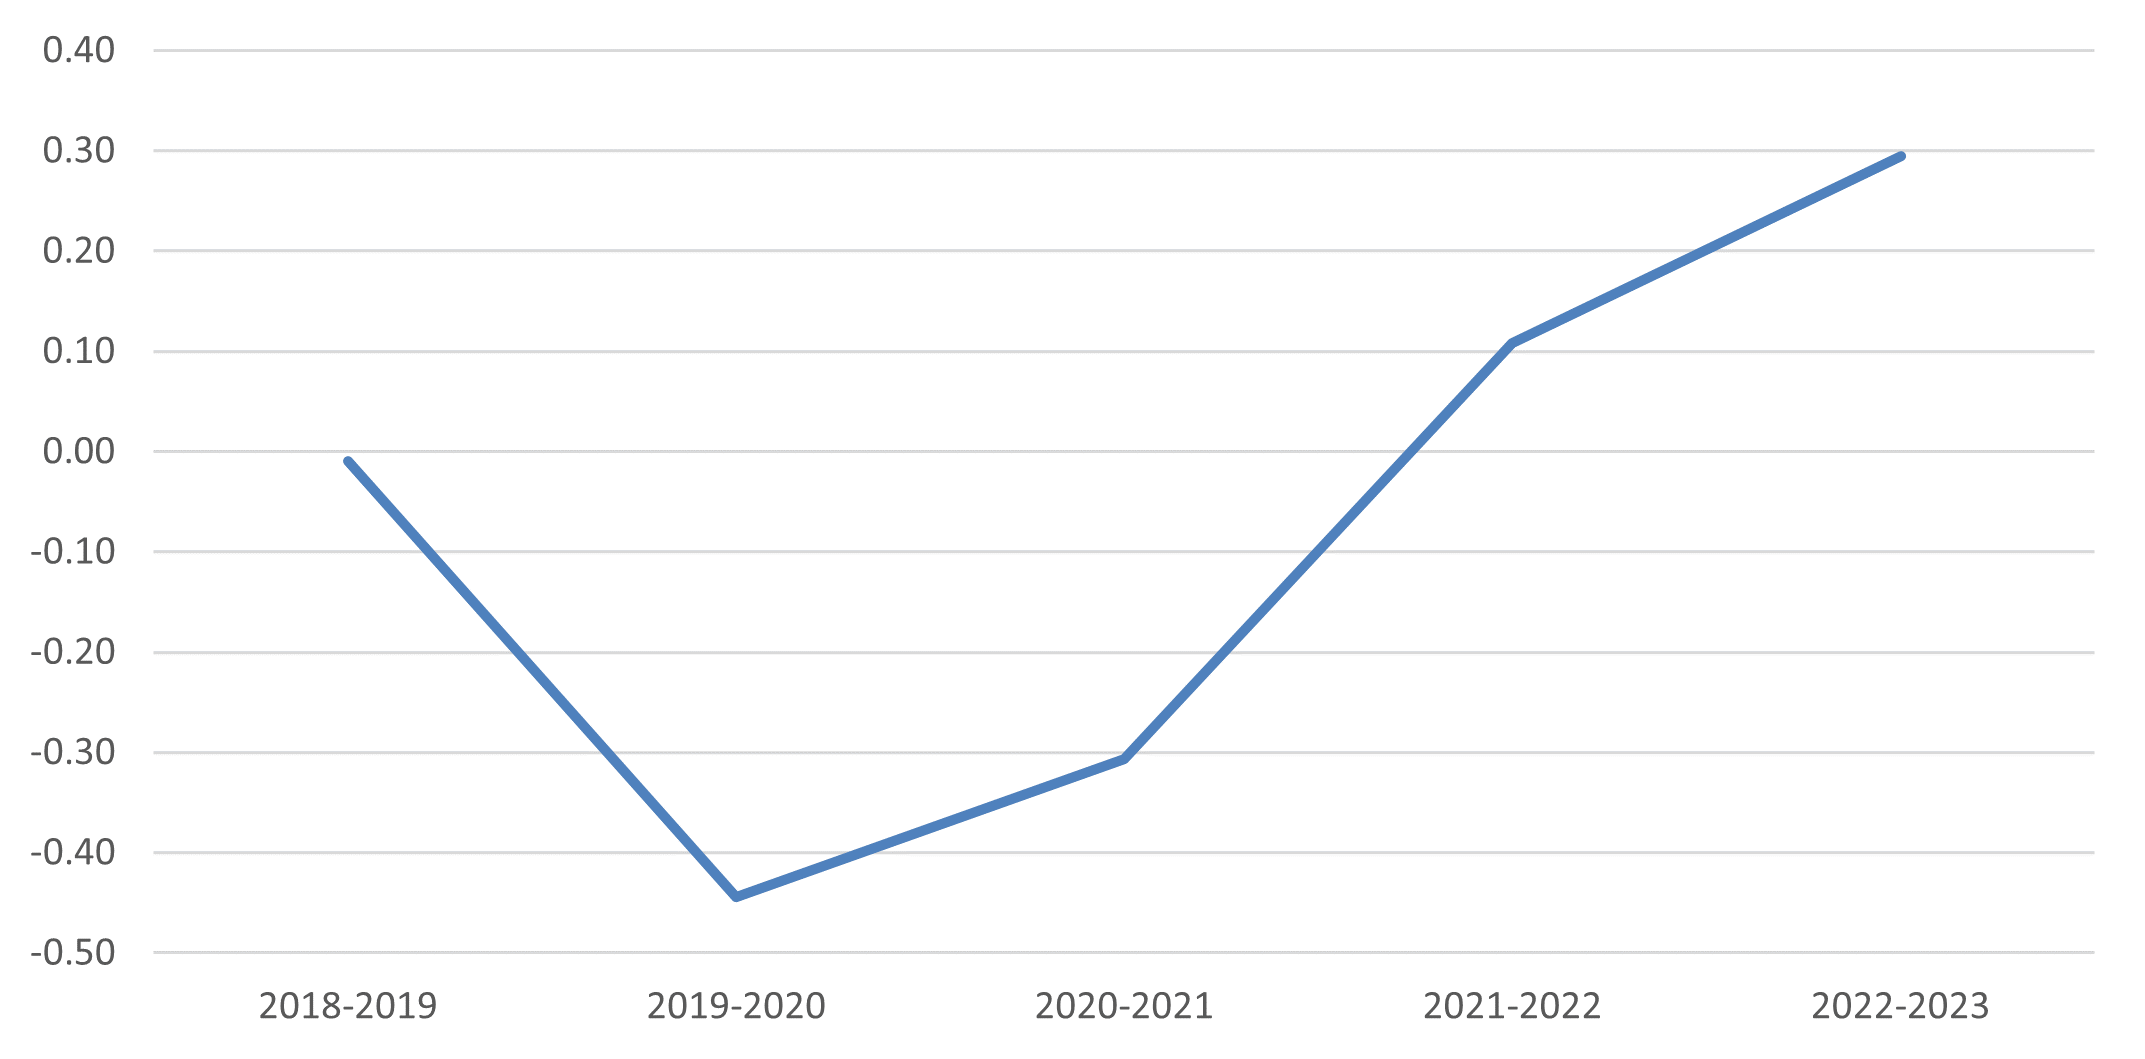
Restaurants are among the top places for foot traffic visits in the Greater Chatham neighborhood. For these estimates, we again draw on Advan Research data, which has been widely used in analyses of visits to restaurants and other “points of interest” (e.g., malls, retail stores, and hospitals), despite some limitations to the data.5 Between 2019 and 2023, about 8% of foot traffic to a point of interest in Greater Chatham went to a restaurant. That is, even during a period that covers the Covid-19 pandemic, restaurants in Greater Chatham were among the top places visited in the neighborhood, and were estimated to have seen more than two million cumulative visits (figure 4). After a substantial drop-off in foot traffic in 2020 due to the pandemic, restaurant visits have since trended upward (figure 5).
4. Share of foot traffic visits to points of interest in Greater Chatham, 2019–23
| Lessors of real estate (shopping malls) | 13.5 |
| Restaurants | 8.2 |
| Gasoline stations | 7.8 |
| Health and personal care stores | 7.8 |
| Museums, historical sites, and similar institutions | 6.2 |
| Personal care services | 4.9 |
| Grocery Stores | 4.1 |
| Activities Related to Credit Intermediation | 4.0 |
| Offices of Physicians | 3.3 |
| Warehouse clubs | 3.2 |
| Religious organizations | 3.1 |
| Rail transportation | 3.0 |
| Elementary and secondary schools | 3.0 |
| Automotive repair and maintenance | 2.0 |
| Clothing stores | 1.8 |
| Depository credit intermediation | 1.4 |
| Wireless communication carrier | 1.4 |
| Building material and supplies dealers | 1.3 |
| Agencies, brokerages, and other insurance related activities | 1.3 |
| Medical and diagnostic laboratories | 1.1 |
5. Percent change year over year in Greater Chatham monthly restaurant visits
Restaurants in Greater Chatham attract more than half of their visitors from other neighborhoods across the South Side
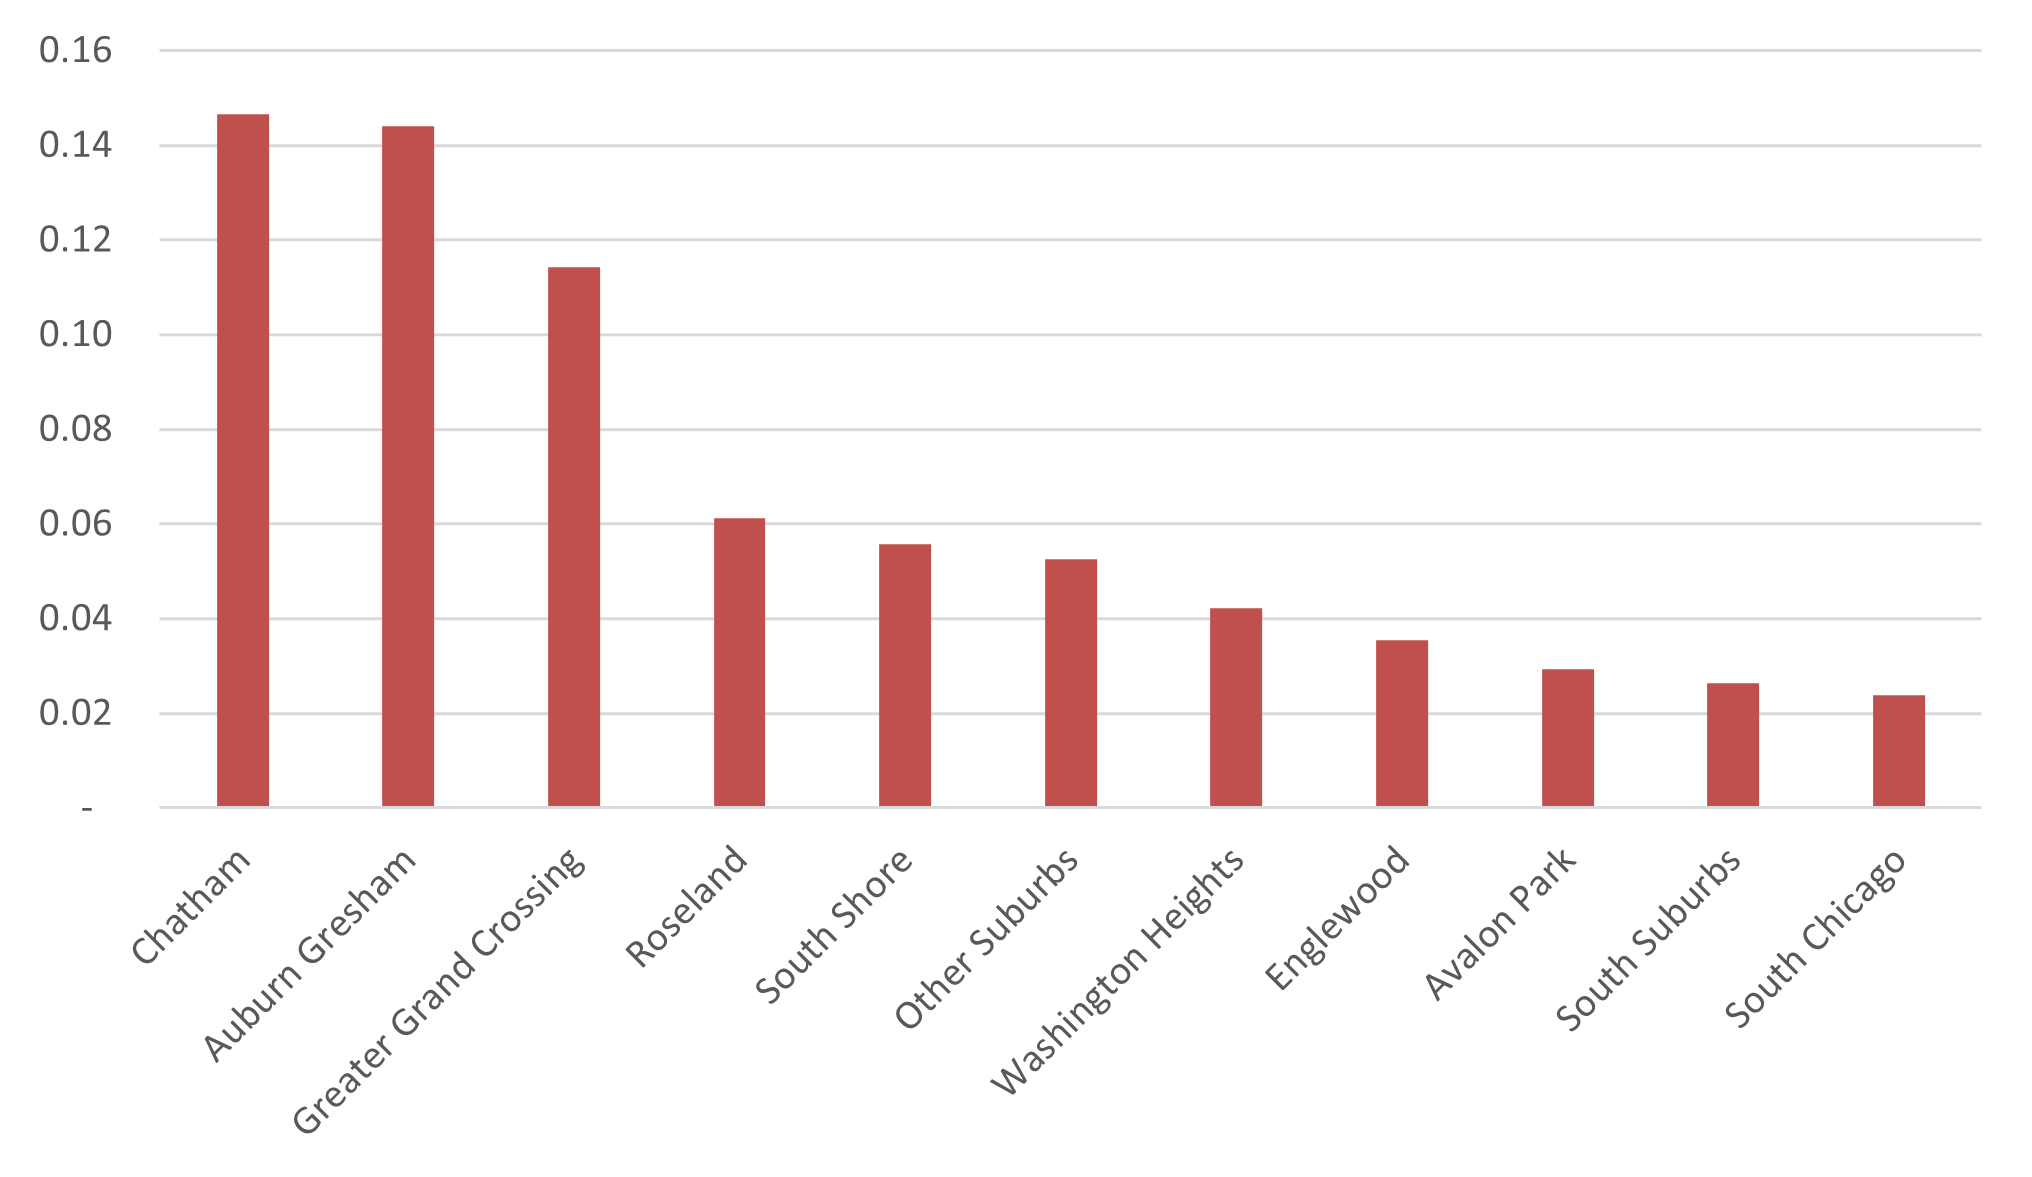
Figure 6 shows details of the location of visitors. Over 40% of restaurant visits in Greater Chatham are from residents of the four community areas. That means more than half of visits are from other places. Almost three quarters of these are from other South Side community areas (including the Far South, Southwest, Far Southwest, and Southeast neighborhoods), and another 5% are from the South suburbs. The remainder are dispersed throughout the city and suburbs. This geolocation data provides local economic developers with additional insights for planning and investing.
6. Share of visits to Greater Chatham restaurants by Chicago community area
Conversations with practitioners underscore the resilience of neighborhood restaurant owners
We conducted several interviews with corridor experts to gain their perspectives on the restaurant ecosystem. In these conversations, experts in Greater Chatham outlined two main challenges facing restaurant owners. First, the building stock makes many restauranteurs who want to provide more sit-down areas unable to find suitable spaces. Upgrades to commercial infrastructure are essential for attracting tenants who might expand dine-in opportunities. In this respect, corridor leaders note the effectiveness of programs funded by the City of Chicago, past and present, that have helped local owners purchase or rehab their buildings.6 Another challenge is preparedness to access capital. According to interviews, training for restauranteurs, including programs that already operate in Greater Chatham and elsewhere, help owners build business skills alongside their culinary talents.7 Demonstrating financial acumen not only helps owners tell their stories, but also increases their prospects of qualifying for credit and potentially winning government or philanthropic support.
One key take-away from corridor experts is that creativity, as well as capital, are needed to support the restaurant corridors. Corridor leaders describe restaurants as an important generator of income for owners and employees in Greater Chatham. They also provide a service for community members, they help drive local commerce, and they often reflect and reinforce the cultural dimension of the neighborhood. In Greater Chatham, assistance to restaurant owners has come by way of tapping into local, state, and federal resources to complement bank financing; and by (community leaders) identifying funding opportunities for layering various sources together. But it has also come by innovating around other connections to existing businesses—that is, pop-up permits and sidewalk activations focusing on entertainment, shopping, or engagement with volunteers—to encourage people to come to or spend more time in the neighborhood. For corridor leaders, Greater Chatham is the neighborhood where people from the South Side and South suburbs shop; and visitors who come to restaurants from outside the neighborhood often want a taste of home. Marketing the ethnic character of local businesses is therefore part of the strategy.
Notes
1 Chatham is one of the community areas promoted by the city of Chicago, and it identifies restaurants as among its attractions.
2 When a cellphone user opts in, Advan matches geolocation pings generated by third-party applications on their cellphone to businesses and public places and classifies a visit when the cellphone stays at the location for at least four minutes.
3 The difference in restaurant counts between Advan Research and the County Business Patterns may reflect differences in time periods: CBP is from the first quarter of 2022 and Advan Research is from 2019–23. In addition, the CBP does not include businesses operating without employees or an Employer Identification Number, while data from Advan Research might include such businesses. According to the Census Bureau, a certain amount of under-coverage occurs in the CBP, primarily with establishments for multi-unit companies (a company that owns or operates two or more establishments).
4 At full-service restaurants, patrons pay after eating. At limited-service restaurants, patrons pay before eating.
5 Some limitations to the data are that the sample is incomplete (10%) and changes over time, the geolocation data does not capture all visits to all restaurants, and Advan Research adds artificial data distortions to the counts of visits, which may affect calculations of where restaurant visitors came from. See Wang et al. (2023) and Huang et al. (2022). For use of Advan Research beyond restaurants see, for example, Hartley et al. (2024) and Huntington-Klein (2020).
6 For example, see City of Chicago Neighborhood Opportunity Fund; Chicago Recovery Plan; and Small Business Improvement Fund.
7 More information at FoodLab Chicago.


