

Payday lenders offer short-term, small-dollar, and high-interest consumer loans. Consumers get payday loans primarily from state-licensed storefront locations—of which there were an estimated 13,700 nationwide in 2018—where loans have a median amount of $350 and typical fees equate to an average annual percentage rate (APR) of almost 400%. Unlike traditional financial institutions, such as banks and credit unions, there is no centralized national database on the location of payday lender storefronts.
This article uses data that provide the zip codes of licensed storefront payday lenders in Illinois beginning in 2006 and ending in 2021 after which, under the Predatory Loan Prevention Act, there were no longer any licensed payday lenders in the state. This data set allows us to document the locations of payday lender storefronts in Illinois during a period of consolidation in the payday lending industry, bookended by two major economic disruptions: the subprime mortgage crisis and Great Recession that ensued and the Covid-19 pandemic.
Because few states keep historical records of licensed payday lenders and their locations, these Illinois licensure data offer a rare glimpse at where payday lenders locate their storefronts. In particular, we find the following key facts about Illinois payday lenders:
- Over two-thirds of lenders located their storefronts in clusters—zip codes with two or more storefronts—with the largest clusters in high-population zip codes.
- Payday lenders were substantially more likely to locate and cluster their storefronts in zip codes with a relatively high fraction of residents in poverty.
- Payday lenders were substantially more likely to locate and cluster their storefronts in zip codes with a relatively high fraction of the residents reporting their race and ethnicity as other than non-Hispanic White to the U.S. Census Bureau.
- Payday storefronts followed similar location patterns in Chicago as they did across all of Illinois.
Our findings are consistent with limited prior research on the location of payday lenders, which have found that payday lenders were more likely to have storefronts in majority African American and Latino communities in California and in neighborhoods without bank branches in Cook County, Illinois.
There is a tension between payday loans offering much-needed credit and their ability to create or exacerbate financial distress. When they increase access to credit, payday loans can help borrowers navigate emergency financial distress by providing a quick source of cash. However, critics argue that they often harm consumers,1 including by creating a cycle of debt that makes it more difficult to pay other bills.2 Cycles of debt are possible because borrowers roll over 80% of payday loans after their initial two-week period, and with APRs of up to 600%, a small-dollar loan can quickly become a major expense. Furthermore, given that people with low and unstable incomes are more likely to access short-term credit via nontraditional financial services, consumer advocates have expressed concerns that the potential cycle of debt caused by payday loans disproportionately impacts low-income and majority non-White communities.3
Data
Illinois is one of a few states that publish a historical list of payday lender licenses, which includes a physical address, license start date, and license end date. Illinois required each storefront to have a separate license. These data contain active licenses from 2006 through 2021. We merged this license information with American Community Survey (ACS) demographics data at the zip code level.4 Additionally, Illinois published the number and volume of payday loans originated each year, although these are not broken out by individual payday lender.
Although payday lenders can operate partially or entirely online, we analyze the location of payday lender storefronts, which near the beginning of our license data period were used by over 75% of all payday loan consumers. The Consumer Financial Protection Bureau reported that online payday lending increased substantially during the period of our analysis, while storefronts and storefront loan volume declined due in part to consolidation and changes in state laws. From 2014 to 2018, the number of storefronts and the new lending they generated each year declined by about 50%. Still in 2018, storefront loans remained the primary channel through which consumers obtained payday loans.
The Illinois data set presents one potential problem: It includes licensed lenders that operate entirely online or that operate both online and in storefronts. Online-only lenders have no storefronts and report the zip code of their headquarters. When these “passive” headquarters are outside of Illinois, we exclude them from our analysis. However, the data do not differentiate between an Illinois storefront address and an Illinois passive headquarters address for a lender that makes online loans. Thus, there is some risk that we may conflate a passive headquarters location with a storefront location, a risk that likely increases as online lending becomes more prevalent.
In the analysis below, we assume all licensee zip codes in Illinois are the locations of storefronts. We consider this assumption reasonable based on our analysis of the data. Over 90% of the payday lenders in our data belong to a chain (of which the average size is 24 licenses), which we define as multiple physical addresses sharing the same brand name. We expect that an online-only lender has only one address under their name (the headquarters), which means that online-only lenders and their headquarters make up, at most, 10% of our sample. Additionally, if a chain of lenders also has an online platform that is licensed under a headquarters address that is not also a storefront, these “passive” headquarters would make up, on average, only 4% of all chain locations. Thus, we conclude that, at most, 14% of the licenses in our sample are not storefronts, but the true percentage is likely much less.5 To further corroborate this, we did an intensive follow-up on a random sample of addresses and found that 90% are in commercial centers, such as shopping plazas, that typically feature storefronts rather than office space.
Payday lender consolidation and lending from 2006 to 2021
Figure 1 shows how the number of storefronts in Illinois and the number of payday loans evolved during this period. Consolidation is evident from the decline of storefronts. In 2021 Illinois had just over 350 storefronts, fewer than it had in 2006 and more than 40% fewer than in 2011, when storefronts peaked at 636. Economic disruptions are also apparent. The figure shows a sharp decline in payday loans between 2005 and 2010, which includes the Great Recession, a steady increase from 2011 to 2016, a decline of about 15% between 2017 and 2019, and a collapse during the pandemic years of 2020 and 2021. These are broadly consistent with national trends.6
1. Number of payday lenders and payday loans in Illinois, 2006–21
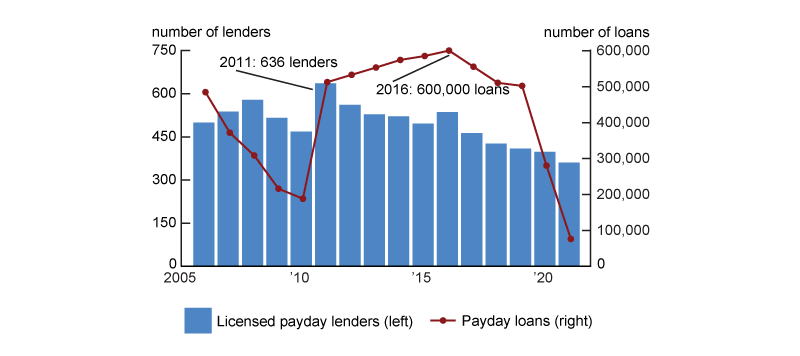
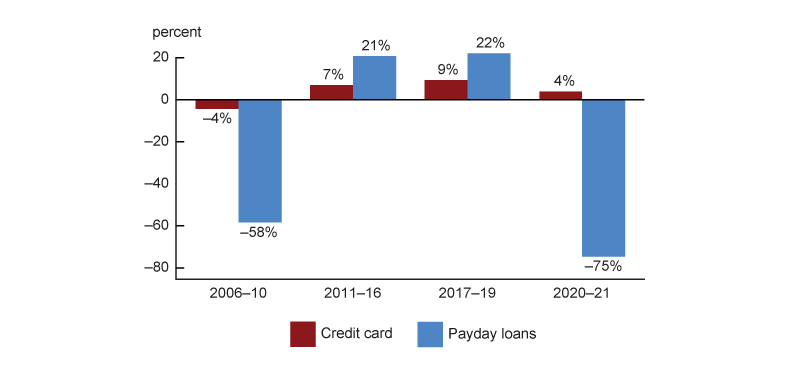
Payday lending occurs on a much smaller scale than traditional credit options, such as credit cards: In 2016 Illinois saw $328 million of payday loan originations, whereas credit card debt in the state exceeded $30 billion. However, figure 2 shows that changes in total payday loan debt were more volatile over time than changes in credit card debt. For example, during the 2006–10 period, payday debt fell by 58%, while credit card debt fell only 4%. Similarly, from 2011 to 2016, payday debt grew more than credit card debt, with growth rates of 21% and 7%, respectively.
2. Changes in credit card debt and payday lending volume in Illinois, 2006–21
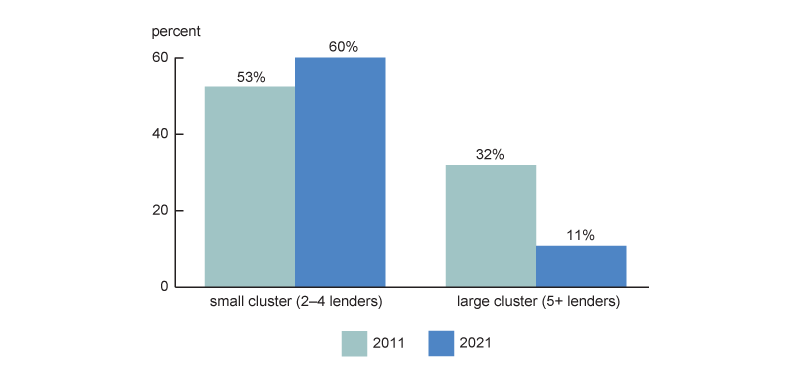
Key finding: Over two-thirds of lenders located their storefronts in clusters—zip codes with two or more storefronts—with the largest clusters in high-population zip codes.
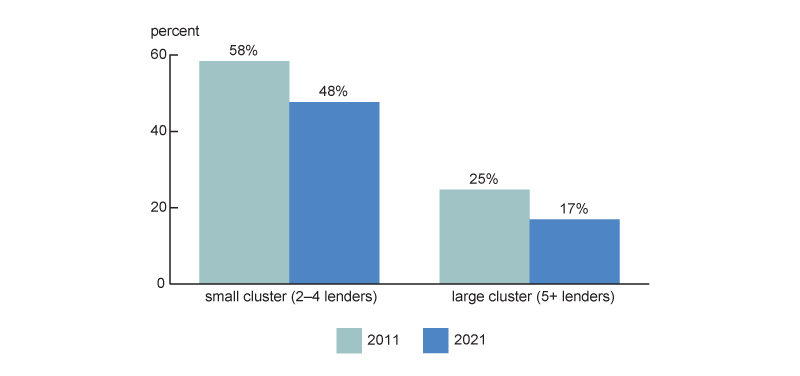
In every year in our data set, most payday storefronts were in a “cluster,” which we define as a zip code with two or more payday storefronts. Figure 3 shows this for both 2011 and 2021. In 2011, 85% of payday lenders were in a cluster; 53% were in small clusters of two to four lenders, while 32% were in large clusters of five or more lenders. Fewer payday storefronts belonged to clusters by 2021, but at 71% they were still the majority. The number of payday lenders in large clusters fell to 11%, but the percentage in small clusters remained near 60%.
3. Clusters of payday lenders in Illinois, 2011 versus 2021
The rate of clustering was surprisingly high, since Illinois had approximately 1,300 zip codes in both 2011 and 2021. This means that the average zip code had 0.5 payday lenders in 2011 and 0.3 payday lenders in 2021. If payday lenders were to distribute themselves randomly across these 1,300 zip codes, only 39% and 24% would have been in clusters of two or more storefronts in 2011 and 2021, respectively.7
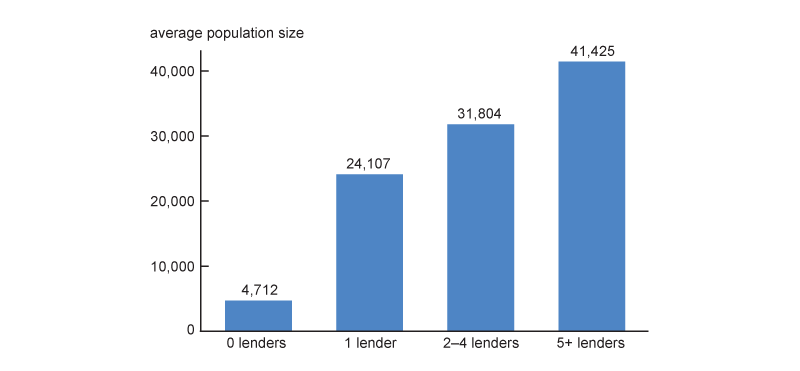
Figure 4 demonstrates that on average, zip codes with a payday lender had more than six times as many residents as their counterparts with zero lenders. Additionally, zip codes with the most payday lenders tended to have the largest populations. The largest clusters were concentrated in zip codes with relatively large populations: Zip codes with over five lenders had 72% more residents on average than those with just one lender.
4. Population size and number of payday lenders in Illinois zip codes, 2011
Key finding: Payday lenders were substantially more likely to locate and cluster their storefronts in zip codes with a higher fraction of residents in poverty.
We find that payday lenders were relatively concentrated in zip codes with high poverty levels, regardless of population size.
Figure 5 shows that among zip codes of similar population size, the quartile with the highest poverty levels were at least three times as likely to have a payday lender than zip codes with the lowest poverty levels. In zip codes with 20,000 to 25,000 residents, 75% of high-poverty zip codes had a payday lender, whereas only 25% of low-poverty zip codes did. This difference was more pronounced among larger zip codes of 25,000 to 30,000 residents: Every high-poverty zip code in this bucket had at least one payday lender, whereas only 21% of their low-poverty counterparts did.8
5. Prevalence of payday lenders by population size and poverty level in Illinois zip codes, 2011
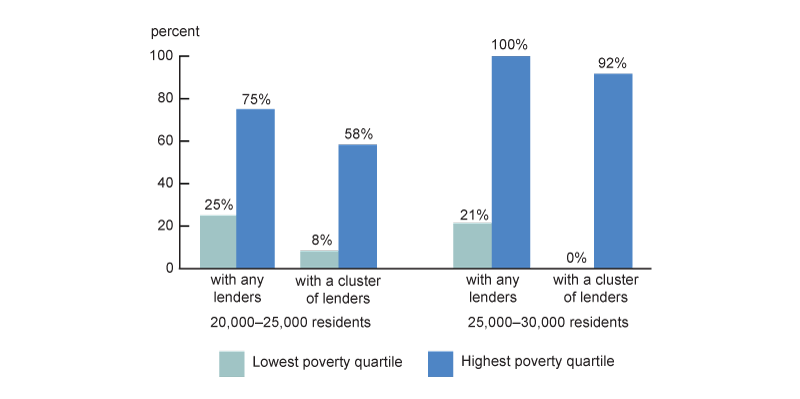
Additionally, the figure shows that high-poverty zip codes were more likely to have clusters of payday lenders. Over half of the highest-poverty zip codes with 20,000 to 25,000 residents had a cluster of payday lenders, whereas less than 10% of their low-poverty counterparts did. Once again, this difference was more pronounced among zip codes with 25,000 to 30,000 residents, where none of the low-poverty zip codes had a cluster of lenders and over 90% of the highest-poverty zip codes did.9
Key finding: Payday lenders were substantially more likely to locate and cluster their storefronts in zip codes with a larger fraction of the residents reporting their race and ethnicity as other than non-Hispanic White to the U.S. Census Bureau.
Similarly, payday lenders were relatively more concentrated in zip codes that had a higher percentage of residents that reported their race and ethnicity as other than non-Hispanic White (hereafter referred to as non-White residents). Figure 6 shows that, regardless of population size, payday lenders were more likely to cluster in zip codes with the highest percentage of non-White residents.
6. Prevalence of payday lenders by population size and share of non-White residents in Illinois zip codes, 2011
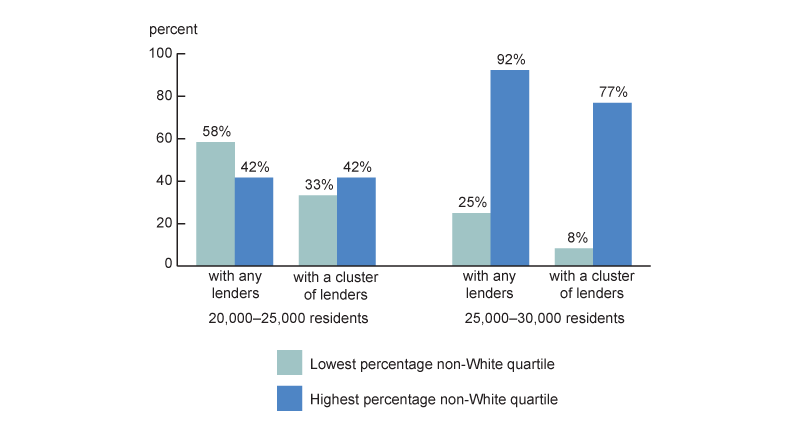
Among zip codes with 20,000 to 25,000 residents, those in the quartile with the highest percentage of non-White residents were 28% less likely to have a payday lender than their counterparts in the quartile with the lowest percentage of non-White residents. However, they were more likely to have a cluster of two or more payday lenders. Indeed, every one of these top quartile zip codes with a payday lender had a cluster of lenders.
Among zip codes with populations ranging from 25,000 to 30,000, those in the quartile with the highest percentage of non-White residents were over three times more likely to have a payday lender and nine times more likely to have a cluster of payday lenders than their counterparts in the lowest quartile. The relationship between payday lenders and the percentage of non-White residents was more pronounced among these zip codes, just as the relationship between payday lenders and poverty was more pronounced in high-population zip codes.
Key finding: Payday lenders followed similar location patterns in Chicago as they did across all of Illinois.
We find payday lenders in Chicago located their storefronts similarly to their counterparts across all of Illinois. Only a minority of Illinois payday lenders were in Chicago—in 2011, the city had 89 payday lenders, or 14% of the state’s total payday lenders. This number fell to 65 in 2021, or 18% of the state’s total. These percentages were slightly smaller than the 21% of Illinois residents who resided in Chicago.10
Reflecting the pattern across all of Illinois, Chicago’s payday lenders were likely to be in clusters. Figure 7 demonstrates that 83% of Chicago lenders were in a cluster in 2011, with 58% in a small cluster and 25% in a large one. By 2021 this number had fallen, but the majority (65%) were still in a cluster.
7. Clusters of payday lenders in Chicago, 2011 versus 2021
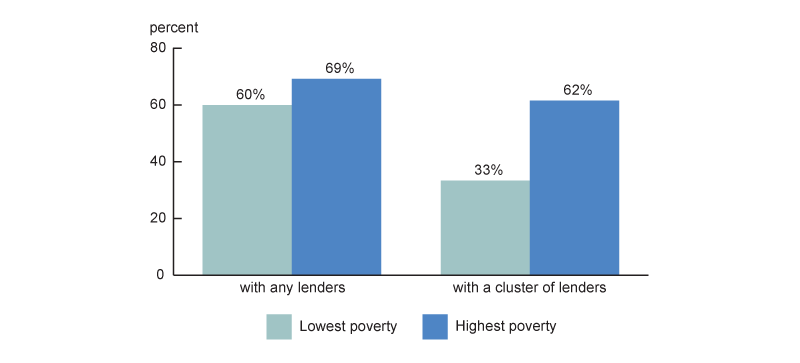
Additionally, payday lenders in Chicago were more likely to locate storefronts and have clusters in high-population, high-poverty, and majority-non-White zip codes. We find that payday lenders avoided the absolute highest-poverty zip codes: Among the three Chicago zip codes with the highest poverty levels in 2011, none of them had a payday lender.11 Figure 8 shows that, after dropping the three high-poverty outliers, Chicago zip codes in the quartile with the highest poverty levels were 15% more likely to have at least one payday lender and 88% more likely to have a cluster of lenders than those zip codes in the quartile with the lowest poverty levels.
8. Prevalence of payday lenders by population size and poverty level in Chicago zip codes, 2011
We also find (not shown) that Chicago looks like all of Illinois in terms of the relationship between lender location and race and ethnicity: The quartile of zip codes with the highest percentage of non-White residents were 5% more likely to have at least one payday lender and more than five times as likely to have a cluster of payday lenders than the quartile of zip codes with the lowest percentage of non-White residents.
Conclusion
In 2021, Illinois passed the Predatory Loan Prevention Act (PLPA), which capped the annual percentage rate on most consumer loans, including payday loans, at 36%. Given that payday lenders typically charge rates of above 200%, this effectively eliminated the industry in the state. However, the historical data on payday lenders in Illinois offer a perspective on an industry that still has a presence nationwide and in the four other states—Iowa, Indiana, Michigan, and Wisconsin—within the Seventh District of the Federal Reserve System served by the Chicago Fed.
There were still 361 payday storefronts open in Illinois when the PLPA was passed; all of them closed after 2021. Prior to their closure, these storefronts were still clustered in 199 zip codes with relatively high poverty levels and a relatively large percentage of non-White residents.
Given the large presence of payday lenders when the 2021 law was passed, it would be interesting to learn how consumers responded to their closure. The 2021 law was promoted as a victory for consumers who may have previously been trapped in high-interest debt cycles. However, there is evidence from policy changes in other states that former payday users shifted to using other forms of high-interest lending to meet their credit needs. Illinois consumers can still access entities unaffected by the legislation, such as pawnshops, which continue to operate with interest rates that can exceed 100% APR. A 2022 poll of low-income consumers in Illinois found that after the passage of the PLPA, they were most likely to address credit needs through credit cards, tapping into personal savings, or getting assistance from family, friends, and community organizations. As more banks and community development financial institutions (CDFIs) move into the small-dollar credit space, consumers may have access to more affordable options for short-term loans.
Notes
1 Examples of critics arguing that payday loans harm consumers include Consumer Financial Protection Bureau (2017), Bazelon (2014), and Klein (2016).
2 See, for example, Melzer (2011).
3 Examples of consumer advocates expressing concerns over payday loans disproportionately impacting low-income and minority populations include Leuthy (2023), Kurban, Diagne, and Otabor (2014), Hawkins and Penner (2021), and Yee (2024).
4 American Community Survey data used are tables S1701 and B02001, 2015 five-year estimates at the zip code tabulation area (ZCTA) level.
5 In the most extreme scenario, we assume that the 10% of non-chain licenses are all headquarters rather than storefronts. We also assume that each chain participates in online lending and attribute this lending to a license with the headquarters address rather than a storefront address. Given that a chain has on average 24 licenses, this headquarters license would make up 4.2% of all chain licenses. Chain licenses are 90% of the sample, so this would be 3.8% of the total sample. Adding these two numbers together, we find that headquarters’ addresses should make up at most 13.8% of the sample. However, it is unlikely that all non-chain licenses are passive headquarters rather than storefronts, and we do not believe that each chain participates in online lending and lists a passive headquarters location. Therefore, this final number is likely a large overestimate.
6 See Bureau of Consumer Financial Protection (2020).
7 Numbers were computed using the binomial distribution with the number of independent trials being equal to 636 payday lenders in 2011 and 361 payday lenders in 2021, and the probability of success being equal across all 1,300 zip codes at (1/1,300). This yields a 30% (21%) chance that a zip code has exactly one lender in 2011 (2021), which means 61% (74%) of payday lenders are expected to be in a zip code with exactly one lender.
8 This analysis was robust across different population buckets, such as 7,000 to 10,000 residents and 10,000 to 15,000 residents. Here, we show only two buckets to make the graphics easier to follow. We chose the 20,000 to 25,000 and 25,000 to 30,000 buckets because more than half of payday lenders are in zip codes with populations ranging from 20,000 to 30,000 residents.
9 The second and third poverty quartiles’ numbers tended to fall between the first and fourth quartiles’ numbers. Among zip codes with 20,000 to 25,000 residents, 58% of zip codes in the second quartile of poverty levels had a payday lender and 25% of them had a cluster of lenders. In the third quartile of zip codes by poverty level, 92% had a payday lender and 58% had a cluster of payday lenders. Among zip codes of 25,000 to 30,000 residents, 42% of those in the second quartile had any lender, and 33% had a cluster of lenders. Eighty-five percent of zip codes in the third quartile had any lender, and 69% had a cluster.
10 Computation based on 2010 numbers from the Illinois Department of Public Health.
11 This finding is echoed by research that shows that the lowest income households may be “screened out of the payday loan market” due to not having an income stable enough to qualify for a loan (Melzer, 2011).


