

Foreclosure Rate Graphs
Cook County
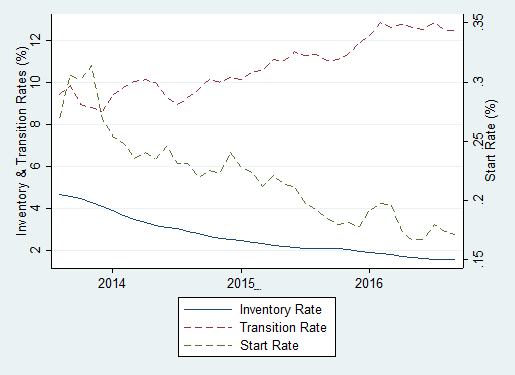
Source: LPS Applied Analytics and Federal Reserve Bank calculations.
Inventory Rate: Represents the number of loans in foreclosure as a proportion of active loans. (Usually referred to simply as the "foreclosure rate").
Transition Rate: Reflects the rate at which loans exit foreclosure. It is expressed as the number of loans that switched from a foreclosure status to a non-foreclosure status during a particular month as a proportion of loans in foreclosure.
Start Rate: Reflects the rate at which loans enter foreclosure. It is expressed as the number loans of that switched from a current or delinquent status to a foreclosure status during a particular month as a proportion of actives loans.
Polk County
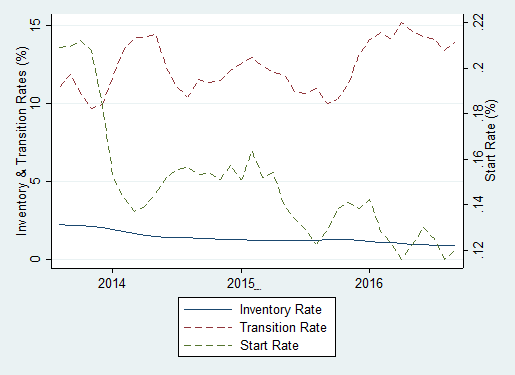
Source: LPS Applied Analytics and Federal Reserve Bank calculations.
Inventory Rate: Represents the number of loans in foreclosure as a proportion of active loans. (Usually referred to simply as the "foreclosure rate").
Transition Rate: Reflects the rate at which loans exit foreclosure. It is expressed as the number of loans that switched from a foreclosure status to a non-foreclosure status during a particular month as a proportion of loans in foreclosure.
Start Rate: Reflects the rate at which loans enter foreclosure. It is expressed as the number loans of that switched from a current or delinquent status to a foreclosure status during a particular month as a proportion of actives loans.
Marion County
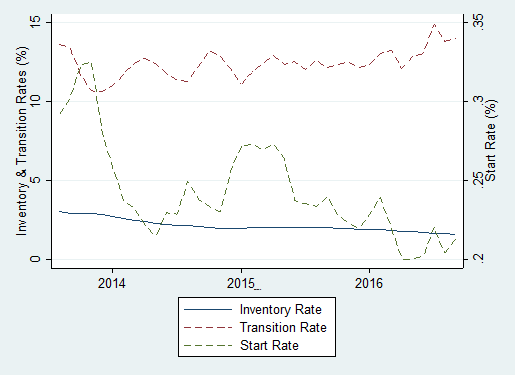
Source: LPS Applied Analytics and Federal Reserve Bank calculations.
Inventory Rate: Represents the number of loans in foreclosure as a proportion of active loans. (Usually referred to simply as the "foreclosure rate").
Transition Rate: Reflects the rate at which loans exit foreclosure. It is expressed as the number of loans that switched from a foreclosure status to a non-foreclosure status during a particular month as a proportion of loans in foreclosure.
Start Rate: Reflects the rate at which loans enter foreclosure. It is expressed as the number loans of that switched from a current or delinquent status to a foreclosure status during a particular month as a proportion of actives loans.
Wayne County
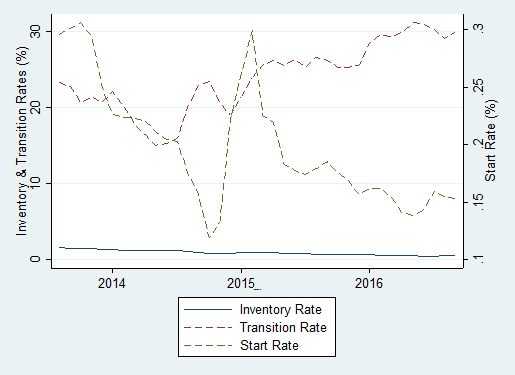
Source: LPS Applied Analytics and Federal Reserve Bank calculations.
Inventory Rate: Represents the number of loans in foreclosure as a proportion of active loans. (Usually referred to simply as the "foreclosure rate").
Transition Rate: Reflects the rate at which loans exit foreclosure. It is expressed as the number of loans that switched from a foreclosure status to a non-foreclosure status during a particular month as a proportion of loans in foreclosure.
Start Rate: Reflects the rate at which loans enter foreclosure. It is expressed as the number loans of that switched from a current or delinquent status to a foreclosure status during a particular month as a proportion of actives loans.
Milwaukee County

Source: LPS Applied Analytics and Federal Reserve Bank calculations.
Inventory Rate: Represents the number of loans in foreclosure as a proportion of active loans. (Usually referred to simply as the "foreclosure rate").
Transition Rate: Reflects the rate at which loans exit foreclosure. It is expressed as the number of loans that switched from a foreclosure status to a non-foreclosure status during a particular month as a proportion of loans in foreclosure.
Start Rate: Reflects the rate at which loans enter foreclosure. It is expressed as the number loans of that switched from a current or delinquent status to a foreclosure status during a particular month as a proportion of actives loans.


