

Summary
Farmland values for the Seventh Federal Reserve District were up 2 percent in the third quarter of 2020 from a year ago, given support from lower interest rates, additional government payments, and some rising agricultural prices. However, values for “good” agricultural land in the District overall were the same in the third quarter of 2020 as in the second quarter, according to the 144 bankers who responded to the October 1 survey. The vast majority of survey respondents (82 percent) anticipated the District’s farmland values to be stable during the fourth quarter of 2020. Yet, notably, more of them anticipated an increase in District farmland values in the final quarter of this year than anticipated a decrease.
The District’s agricultural credit conditions were mixed during the third quarter of 2020. The availability of funds for lending by agricultural banks was much higher in the third quarter than a year ago, but the demand for non-real-estate farm loans was lower than a year earlier for the first time in seven years. Given these results, the average loan-to-deposit ratio for the District dropped to 75.0 percent in the third quarter of 2020. Repayment rates for non-real-estate farm loans were still down relative to the same quarter of the previous year (and loan renewals and extensions were up), yet the pace of the deterioration slowed. As mentioned earlier, average interest rates on agricultural loans slid further during the third quarter of 2020, which helped boost agricultural land values.
Farmland values
The District observed a year-over-year increase of 2 percent in its agricultural land values in the third quarter of 2020. The District had not seen this large of a year-over-year increase in its farmland values during the past six years. Indiana and Wisconsin led the way with year-over-year jumps in their farmland values of 6 percent and 3 percent, respectively; the growth in farmland values in Illinois (2 percent) and Iowa (1 percent) was more modest (see map and table below). On the whole, the District’s agricultural land values were unchanged from the second quarter of 2020, although Illinois’s experienced a 2 percent quarterly decrease.
Percent change in dollar value of “good” farmland
| July 1, 2020 to October 1, 2020 |
October 1, 2019 to October 1, 2020 |
|
|---|---|---|
| Illinois | –2 | +2 |
| Indiana | +2 | +6 |
| Iowa | 0 | +1 |
| Michigan | * | * |
| Wisconsin | +1 | +3 |
| Seventh District | 0 | +2 |
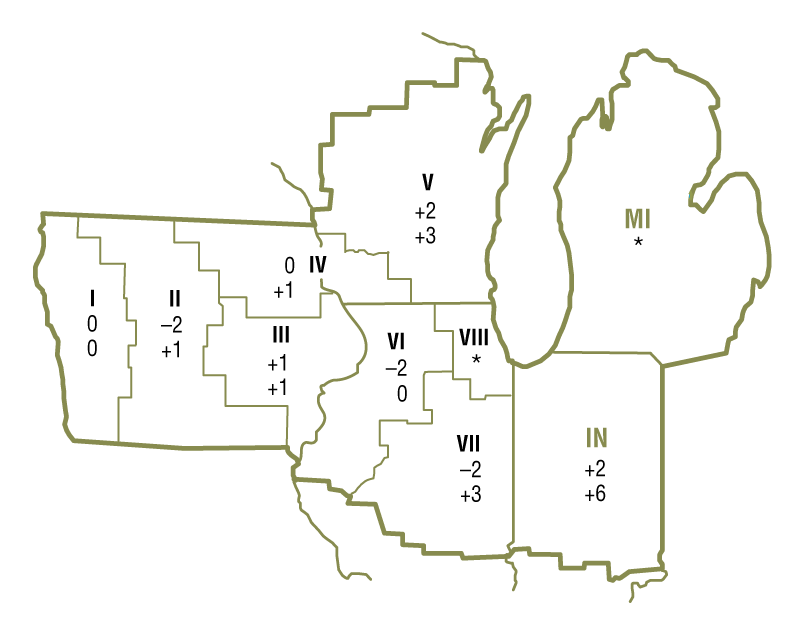
Top: July 1, 2020 to October 1, 2020
Bottom: October 1, 2019 to October 1, 2020
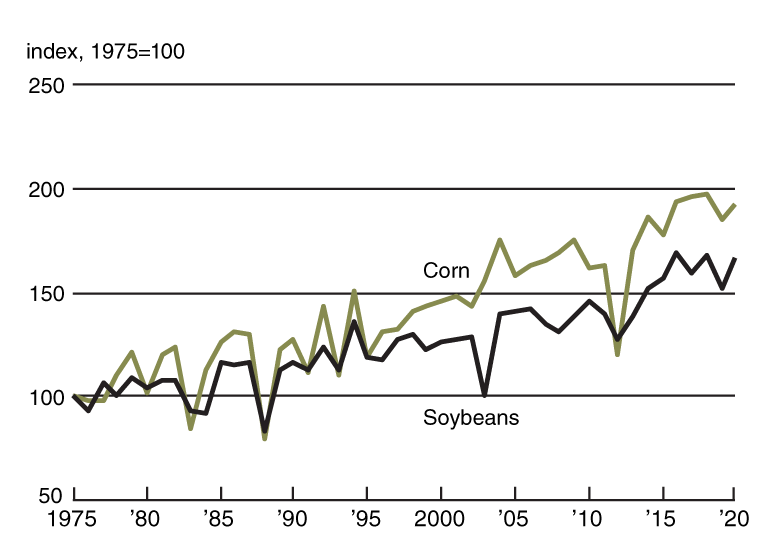
After a very challenging 2019, crop conditions in 2020 were better for most of the District. District-wide corn and soybean yields in 2020 were quite close to their historical highs, with some states reaching record levels, according to U.S. Department of Agriculture (USDA) data (see chart 1). The USDA forecasted the five District states’ harvest of corn for grain in 2020 to increase by 9 percent from 2019, which would put it among the top five of all time. Likewise, the USDA forecasted soybean production for the five District states in 2020 to rise by 16 percent from 2019, which would make it the fourth-largest harvest on record.
1. Corn and soybean yield indexes for Seventh District states
The average price of corn in September 2020 was 9.3 percent higher than in August, but still 10 percent lower than a year ago, based on USDA data (see the final table). Meanwhile, the average price of soybeans in September was 6.7 percent higher than in August and 11 percent higher than a year ago. While the October USDA forecasts for national corn and soybean production were large, they were lower than forecasts made over the summer. Moreover, USDA forecasts for corn and soybean stocks were lower relative to previous estimates. So, given the projected supplies of these crops were revised downward, their prices continued to rise. In October, the USDA raised its price forecasts for the 2020–21 crop year for both crops—to $3.60 per bushel for corn and $9.80 per bushel for soybeans. When calculated with these price estimates, the projected revenues from the 2020 corn and soybean harvests for District states would increase from 2019 by 10 percent and 33 percent, respectively.
In the third quarter of 2020, livestock prices were generally recovering from the impacts of the Covid-19 pandemic. Compared with a year earlier, September average prices for hogs, cattle, and eggs were up 5 percent, 1 percent, and 22 percent, respectively. While milk’s average price in September was down 7 percent from a year earlier, its average price for the third quarter of 2020 was up 1 percent. There was also a pickup in agricultural trade, which helped matters. Additionally, by the end of October, the Coronavirus Food Assistance Program (CFAP) had dispersed over $2.4 billion to farm operations in the five District states (24 percent of the $10.3 billion sent nationwide). As one Wisconsin respondent noted, “With higher prices and government payments, dairy and crop producers will end the year better than expected.”
Credit conditions
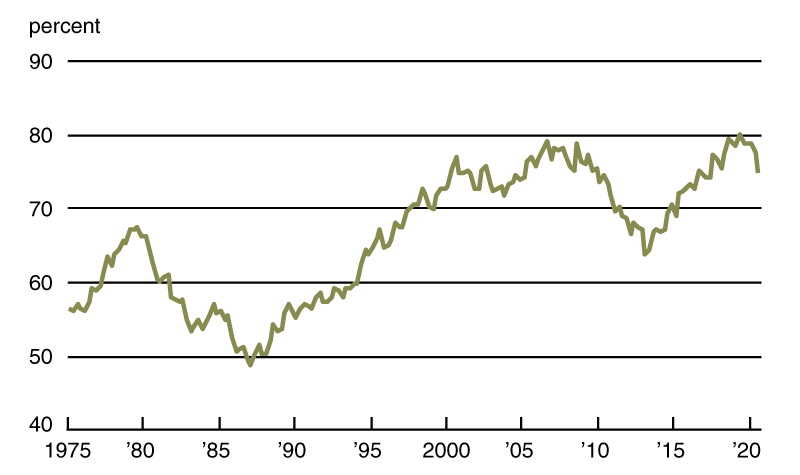
Agricultural credit conditions for the District were mixed in the third quarter of 2020. For the first time in seven years, weaker demand for non-real-estate farm loans compared with a year ago was exhibited in the third quarter of 2020. The index of loan demand dropped to 85 in the third quarter of 2020, as 11 percent of survey respondents noted higher demand for non-real-estate loans than a year earlier and 26 percent noted lower demand. The availability of funds for lending by agricultural banks was sharply higher than a year ago. The index of funds availability moved up to 131 in the third quarter of 2020, as 35 percent of the survey respondents indicated their banks had more funds available to lend than a year earlier and 4 percent indicated their banks had less. With lower loan demand and higher funds availability relative to a year ago, the District’s average loan-to-deposit ratio fell to 75.0 percent (see chart 2). The gap between the average loan-to-deposit ratio and the average level desired by the responding bankers widened to 7.3 percentage points; moreover, two-thirds of the survey respondents’ banks were below their targeted levels for the first time since the first quarter of 2015. Collateral requirements for loans in the third quarter of 2020 were tighter than in the same quarter of last year, as 17 percent of the respondents reported that their banks required more collateral and none reported that their banks required less.
2. Quarterly average loan-to-deposit ratio for Seventh District
For the July through September period of 2020, repayment rates on non-real-estate farm loans were a bit lower than a year earlier. The index of loan repayment rates was 93 in the third quarter of 2020, as 8 percent of responding bankers observed higher rates of loan repayment than a year ago and 15 percent observed lower rates. In addition, renewals and extensions of non-real-estate agricultural loans were higher in the third quarter of 2020 than in the same quarter of 2019, with 27 percent of the responding bankers reporting more of them and 5 percent reporting fewer. As of October 1, 2020, the District’s average interest rates on new operating loans, feeder cattle loans, and farm real estate loans had fallen to their lowest levels on record: 4.65 percent, 4.79 percent, and 4.24 percent, respectively.
Credit conditions at Seventh District agricultural banks
| Interest rates on farm loans | |||||||
| Loan demand | Funds availability | Loan repayment rates | Average loan-to-deposit ratio | Operating loansa | Feeder cattlea | Real estatea | |
|---|---|---|---|---|---|---|---|
| (index)b | (index)b | (index)b | (percent) | (percent) | (percent) | (percent) | |
| 2019 | |||||||
| Jan–Mar | 141 | 86 | 52 | 78.6 | 6.04 | 6.11 | 5.53 |
| Apr–June | 119 | 93 | 74 | 80.2 | 5.98 | 6.14 | 5.39 |
| July–Sept | 115 | 103 | 70 | 78.8 | 5.71 | 5.77 | 5.08 |
| Oct–Dec | 117 | 107 | 79 | 78.9 | 5.49 | 5.61 | 4.97 |
| 2020 | |||||||
| Jan–Mar | 117 | 107 | 59 | 78.9 | 4.83 | 5.01 | 4.51 |
| Apr–June | 103 | 119 | 64 | 77.6 | 4.77 | 4.94 | 4.40 |
| July–Sept | 85 | 131 | 93 | 75.0 | 4.65 | 4.79 | 4.24 |
bBankers responded to each item by indicating whether conditions in the current quarter were higher or lower than (or the same as) in the year-earlier quarter. The index numbers are computed by subtracting the percentage of bankers who responded “lower” from the percentage who responded “higher” and adding 100.
Note: Historical data on Seventh District agricultural credit conditions are available online.
Looking forward
Survey respondents who anticipated District farmland values to rise in the final quarter of 2020 outnumbered those who anticipated them to fall. This last happened in the first quarter of 2013. Fifteen percent of survey respondents predicted District farmland values to increase in the fourth quarter of 2020, 4 percent predicted them to decrease, and 82 percent predicted them to be stable (these values do not sum to 100 percent because of rounding). More respondents also expected both farmers and nonfarm investors to have stronger rather than weaker demand to acquire farmland this fall and winter compared with a year earlier. Moreover, respondents anticipated a rise in the volume of farmland transfers.
In contrast with the pattern of the past few years, crop net cash earnings (which include government payments) were expected to be up during the fall and winter from their levels of a year earlier: 44 percent of survey respondents forecasted crop net cash earnings to increase over the next three to six months relative to a year ago, and 28 percent forecasted these earnings to decrease. According to the responding bankers, the District’s hog, cattle, and dairy farmers were once more anticipated to endure lower net cash earnings over the fall and winter relative to a year earlier.
By a slim margin, survey respondents forecasted loan repayment rates to decline this fall and winter from a year ago: 22 percent of the responding bankers predicted a lower volume of farm loan repayments over the next three to six months compared with a year earlier, while 18 percent predicted a higher volume. In addition, forced sales or liquidations of farm assets owned by financially distressed farmers were expected to increase in the next three to six months relative to a year ago, according to 31 percent of the responding bankers (8 percent expected a decrease). The District’s overall non-real-estate farm loan volume in the October through December period of 2020 was anticipated to be roughly similar to that in the same period of 2019, whereas the District’s volume of farm real estate loans was forecasted to be somewhat higher.
Another Wisconsin banker stated that because federal government payments have made up such a large share of net farm income in 2020, “it will be hard for farmers to find a chair when the music stops.” Until then, the circling continues while the District’s farms prepare for uncertain times ahead.
Selected agricultural economic indicators
| Percent change from | |||||
|---|---|---|---|---|---|
| Latest period | Value | Prior period | Year ago | Two years ago | |
| Prices received by farmers (index, 2011=100) | September | 89 | 0.9 | 1 | 1 |
| Crops (index, 2011=100) | September | 94 | 1.3 | 6 | 6 |
| Corn ($ per bu.) | September | 3.41 | 9.3 | –10 | 0 |
| Hay ($ per ton) | September | 155 | –3.7 | –3 | –5 |
| Soybeans ($ per bu.) | September | 9.24 | 6.7 | 11 | 5 |
| Wheat ($ per bu.) | September | 4.73 | 4.0 | 11 | –8 |
| Livestock and products (index, 2011=100) | September | 84 | 0.2 | –4 | –5 |
| Barrows & gilts ($ per cwt.) | September | 50.90 | 16.2 | 5 | 16 |
| Steers & heifers ($ per cwt.) | September | 105.00 | 1.0 | 1 | –5 |
| Milk ($ per cwt.) | September | 17.90 | –4.8 | –7 | 6 |
| Eggs ($ per doz.) | September | 0.83 | 7.1 | 22 | –11 |
| Consumer prices (index, 1982–84=100) | September | 260 | 0.2 | 1 | 3 |
| Food | September | 269 | 3.6 | 4 | 6 |
| Production or stocks | |||||
| Corn stocks (mil. bu.) | September 1 | 1,995 | N.A. | –10 | –7 |
| Soybean stocks (mil. bu.) | September 1 | 523 | N.A. | –42 | 19 |
| Wheat stocks (mil. bu.) | September 1 | 2,159 | N.A. | –8 | –10 |
| Beef production (bil. lb.) | September | 2.35 | 0.9 | 8 | 9 |
| Pork production (bil. lb.) | September | 2.34 | –0.2 | 4 | 16 |
| Milk production (bil. lb.) | September | 18.0 | –3.2 | 2 | 3 |
| Agricultural exports ($ mil.) | September | 12,227 | 10.1 | 19 | 19 |
| Corn (mil. bu.) | September | 150 | –16.2 | 88 | –28 |
| Soybeans (mil. bu.) | September | 286 | 71.0 | 100 | 140 |
| Wheat (mil. bu.) | September | 99 | 5.1 | 17 | 47 |
| Farm machinery (units) | |||||
| Tractors, 40 HP or more | September | 8,358 | 11.7 | 13 | 34 |
| 40 to 100 HP | September | 6,190 | 3.9 | 14 | 37 |
| 100 HP or more | September | 2,168 | 41.7 | 9 | 25 |
| Combines | September | 631 | 19.7 | 8 | 21 |
Sources: Author’s calculations based on data from the U.S. Department of Agriculture, U.S. Bureau of Labor Statistics, and the Association of Equipment Manufacturers.
CONFERENCE REMINDER
Midwest Agriculture and Shifting Consumer Preferences
On December 1, 2020, the Federal Reserve Bank of Chicago will hold a virtual event on Midwest agriculture and the changes it may face from shifts in consumer demand. Event details and registration are available online.


