What Do the Latest Labor and Migration Statistics Say about Michigan’s Economy and Its Prospects?
Employment levels in Michigan have recently shown signs of improvement. In fact, since the end of the Great Recession in mid-2009, Michigan’s household employment has increased 2.6%, matching the national gain. However, these recent improvements belie Michigan’s poor employment conditions stemming from a long period of subpar economic growth. Indeed, Michigan experienced a “one-state recession” for most, if not all, of the first decade of the twenty-first century.
Facing job eliminations and poor employment prospects, many Michiganders have become discouraged in their job searches, some abandoning them temporarily and others retiring early. Those who are no longer seeking employment are no longer counted as being in the labor force. The chart below illustrates those who remain in the Michigan labor force—which comprises those who are employed along with those who are unemployed but actively looking for work. Since 2001, Michigan’s work force has declined by 10%, while the U.S. work force has grown by almost 10%.
Chart 1. Labor Force: U.S. vs. Michigan, 1990—present
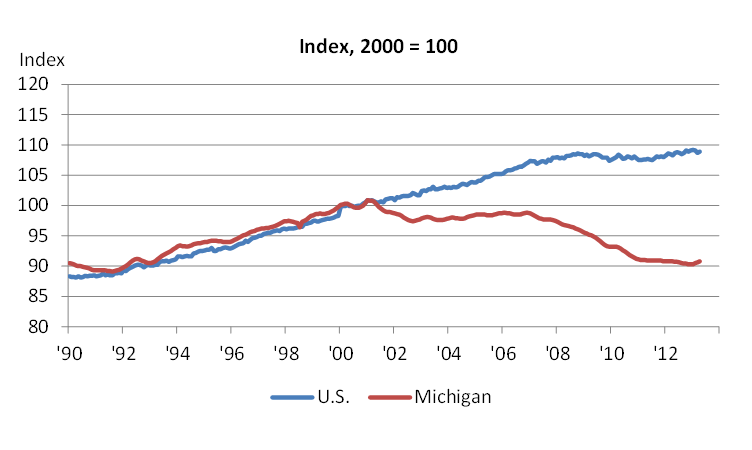
Some part of this gap has come about as hundreds of thousands of Michiganders have left the state in search of better labor market conditions (or have decided to retire out of state). Moreover, since 2000, Michigan’s population decreased 0.7%. In stark contrast, according to the U.S. Census Bureau’s population estimates, the U.S. population grew 11.3%.
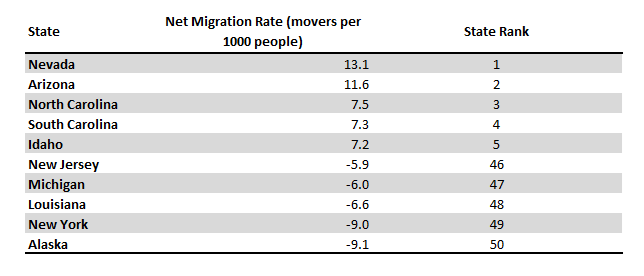
The U.S. Census Bureau’s American Community Survey (ACS) looks at annual migration flows. Table 1 shows both the top five states and the bottom five states by domestic net migration rates over the period 2001–10. One can see that Michigan had one of the highest domestic out-migration flows among the 50 states during that decade.
Table 1. Domestic net migration rates, 2001-10
Even with the ongoing rebound of the auto industry and other manufacturing subsectors, Michigan continues to experience a large out-migration rate; see Table 2, which features the top five states and the bottom six states by domestic net migration rates in 2011–12. Despite the increase in job openings in Michigan, many employers continue to experience difficulty in trying to persuade workers to accept positions there because of the state’s reputation for having a challenging labor market environment.
Table 2. Domestic net migration rates, 2011-12
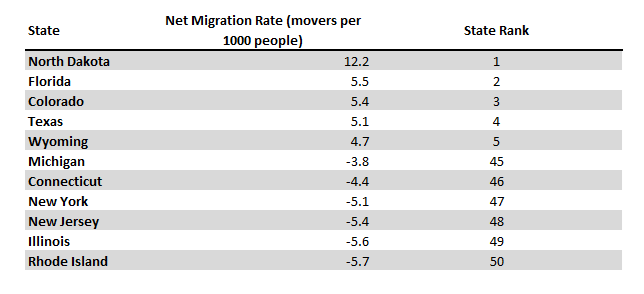
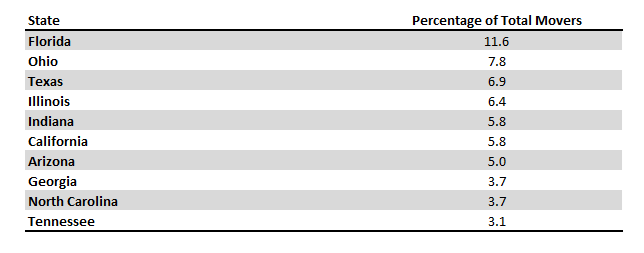
Table 3 shows the top ten destinations for Michigan residents. As one would expect, Michiganders are moving to nearby states—such as Illinois, Indiana, and Ohio. Indiana and Ohio have recently passed legislation that could be described as being more business-friendly: Indiana became a right-to-work state (meaning that the state bars union contracts from requiring nonunion members to pay fees for representation), and Ohio lowered its business taxes. Illinois and Ohio are viewed as more attractive destinations for recent college graduates; large cities in both states have seen rising employment in occupations that typically require a college or post-college degree in part because they are viewed as attractive places for younger college graduates.
Table 3. Top 10 destinations for Michigan residents (percentage of total movers), 2005-11
Another emerging pattern that one might anticipate over the next few years is the movement to warm-climate locations for retirement. Such locales include Sun Belt states, such as Florida and Georgia, and southwestern states, such as California and Arizona. The 2010 U.S. Census data indicate that Michigan has one of the older populations in the nation: Michiganders have a median age of 38.9, which is the 12th highest among all 50 states. Of Michigan’s total population, baby boomers (those aged 45–64) make up 27.9%—tied (with Wyoming) for ninth highest state share of this demographic. Over the next few years, one could expect more population movements out of Michigan to locations popular with retirees.
Table 4 shows some of the top destinations for Michigan residents based on the ACS five-year survey of domestic migration between 2005 and 2009.
Table 4. Top destinations for Michigan residents within top ten destination states (percentage of total movers), 2005-09
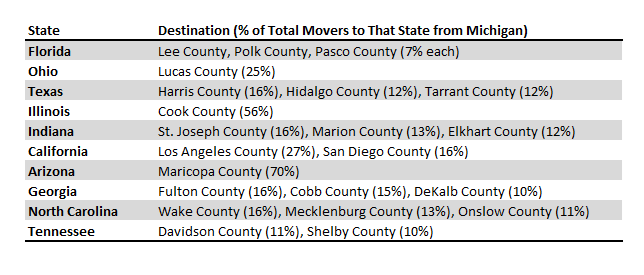
Many of the counties listed above either border Michigan or contain large metropolitan areas—two types of endpoints that one might expect to see when analyzing population movements. The border counties mentioned include cities such as Toledo, South Bend, and Elkhart. The large metropolitan areas found in the counties referenced above include Houston, Fort Worth, Chicago, Indianapolis, Los Angeles, San Diego, Phoenix, Atlanta, Charlotte, Memphis, and Nashville. The only counties that don’t directly fall under either category are Hidalgo County, Texas (which borders Mexico) and the Florida counties. The Florida counties mentioned include areas surrounding the “I-4 Corridor,” which runs through Tampa, Orlando, and Daytona Beach. These counties are prominent locations for retirees and feature easy access to recreation.
Restoring population and work force growth in Michigan will be a challenge given the forces at work inside and outside of the state. A number of public and private programs have been created to attempt to address these forces and attract people back to Michigan. After taking office, Governor Rick Snyder created the Office of Urban and Metropolitan Initiatives, which aims to draw more young graduates, especially those who attended Michigan’s many colleges and universities, to Michigan’s cities. The Michigan Economic Development Corporation replaced the state’s tax credits to clean up and revitalize brownfields (abandoned or underused industrial and commercial facilities) with a community revitalization program that offers grants and loans for individual urban projects. Private investors, such as Dan Gilbert, have moved their offices into downtown areas to try and regenerate urban consumer and business activity. But with the lingering effects of Michigan’s lengthy recession still present in much of the state, Michigan could face a difficult time replenishing its population and work force lost over the past decade.Notes
- The share of the working age population counted in the labor force—that is, both the employed and unemployed (who are actively seeking work)—is referred to as the labor force participation rate. For 2012, Michigan’s labor force participation rate averaged 59.8%—slightly below the nation’s rate of 63.7% that year.
- Natural population growth has also slowed because of out-migration of women of child-bearing age and possibly because of declines in voluntary fertility.


