Post-Recession Trends in Michigan Homeownership: From a Household Income Perspective
In this blog, I examine trends in homeownership and renting in Michigan since the end of the Great Recession. Specifically, I look at the differences in these trends for different household income groups.
Table 1. Homeownership rate: U.S., Michigan, 2009–18
| 2009 | 2010 | 2011 | 2012 | 2013 | 2014 | 2015 | 2016 | 2017 | 2018 | |
|---|---|---|---|---|---|---|---|---|---|---|
| Michigan | 74.5 | 74.5 | 74.1 | 74.8 | 73.9 | 73.8 | 74.6 | 72.8 | 72.9 | 73.0 |
| U.S. | 67.4 | 66.9 | 66.1 | 65.4 | 65.1 | 64.5 | 63.7 | 63.4 | 63.9 | 64.4 |
The chart above shows homeownership rates in Michigan and U.S. since the end of the Great Recession. Homeownership rates trended lower until the past couple of years. For many reasons, homeownership rates have not returned to peak housing bubble levels at the national level or in Michigan.1 In this blog, I look at the income part of the homeownership story.
What is the income profile of the households that own homes? The next table looks at homeownership by income group (real household income) in Michigan.
Table 2. Michigan homeownership (number of households) by real household income, 2009–17
| Income group (000s) | 2009 | 2010 | 2011 | 2012 | 2013 | 2014 | 2015 | 2016 | 2017 |
|---|---|---|---|---|---|---|---|---|---|
| <$10 | 115,197 | 111,243 | 109,692 | 111,209 | 113,040 | 109,520 | 111,881 | 112,014 | 107,646 |
| 10-25 | 359,990 | 362,251 | 354,388 | 353,087 | 350,147 | 339,513 | 332,915 | 322,382 | 300,857 |
| 25-35 | 290,872 | 285,237 | 278,448 | 278,021 | 275,706 | 271,063 | 264,695 | 256,813 | 248,414 |
| 35-50 | 431,988 | 433,561 | 416,266 | 411,472 | 405,288 | 394,274 | 390,221 | 385,219 | 378,141 |
| 50-75 | 613,422 | 604,703 | 590,647 | 581,065 | 570,712 | 564,030 | 556,678 | 551,874 | 549,271 |
| 75-100 | 429,108 | 419,299 | 413,453 | 403,131 | 397,017 | 394,274 | 390,221 | 393,415 | 400,223 |
| 100-150 | 414,708 | 407,889 | 410,641 | 405,911 | 399,774 | 405,226 | 412,051 | 423,468 | 447,145 |
| >150 | 227,513 | 231,042 | 239,072 | 241,879 | 248,136 | 260,111 | 270,153 | 292,329 | 325,698 |
| Sum | 2,882,797 | 2,855,226 | 2,812,607 | 2,785,773 | 2,759,819 | 2,738,012 | 2,728,815 | 2,737,515 | 2,757,396 |
Only the top two income groups have seen increases since 2009. In the top income group, the number of households that owned homes increased 43.2% between 2009 and 2017; and in the second highest group, the number increased 7.8% between 2009 and 2017. In contrast, the number of households that owned homes in the other income groups has fallen well below 2009 levels, though the $75–100,000 income group has seen a slight increase over the past three years.
Calculating the homeownership rate by income group (next table) provides us with a clearer picture of homeownership in Michigan.
Table 3. Michigan homeownership Rates (%) by real household income, 2009–17
| Income group (000s) | 2009 | 2010 | 2011 | 2012 | 2013 | 2014 | 2015 | 2016 | 2017 |
|---|---|---|---|---|---|---|---|---|---|
| <$10 | 37.3 | 36.6 | 36.3 | 36.0 | 36.1 | 35.8 | 36.4 | 37.2 | 37.8 |
| 10-25 | 55.2 | 54.5 | 53.6 | 52.8 | 52.3 | 51.9 | 51.0 | 50.9 | 49.7 |
| 25-35 | 66.7 | 66.3 | 65.6 | 65.6 | 64.4 | 63.8 | 63.2 | 62.2 | 61.6 |
| 35-50 | 75.1 | 75.2 | 73.5 | 73.3 | 72.6 | 71.0 | 70.5 | 69.8 | 68.8 |
| 50-75 | 83.2 | 82.8 | 82.6 | 81.8 | 81.1 | 79.6 | 78.8 | 77.3 | 76.2 |
| 75-100 | 90.4 | 90.1 | 89.3 | 88.7 | 87.3 | 86.6 | 85.4 | 84.9 | 84.3 |
| 100-150 | 95.1 | 93.9 | 93.3 | 93.2 | 91.7 | 91.3 | 90.9 | 89.9 | 89.3 |
| >150 | 96.6 | 96.9 | 94.7 | 94.5 | 95.4 | 94.4 | 93.8 | 93.5 | 93.5 |
Except for the lowest income group and a one-year bump in the homeownership rate for the middle income group in 2010 and top income group in 2013, homeownership rates fell across household income groups between 2009 and 2017. Although homeownership rates fell in the top two income groups, the number of homeowners in those groups increased, meaning that the growth rate in numbers of homeowners was below the growth rate of the population in these top two income groups.
Why did Michigan’s homeownership rate increase then between 2016 and 2018? The number of households that owned homes in the top three income groups, where homeownership rates are the highest, grew 15.5% between 2009 and 2017. The total number of owner-occupied units increased at a slightly faster rate than the total number of households during those three years.
There are a couple of possible explanations for why lower and middle income groups have encountered challenges to homeownership. First, wage gains have been slower to recover for low-to-moderate income groups during the current economic expansion.2 Rising student loan debt has served as a barrier to homeownership for many as well, especially at the lower end of the income spectrum.3 Also, mortgage markets have opened up at a slower pace for those with lower credit scores since the latest recession.4
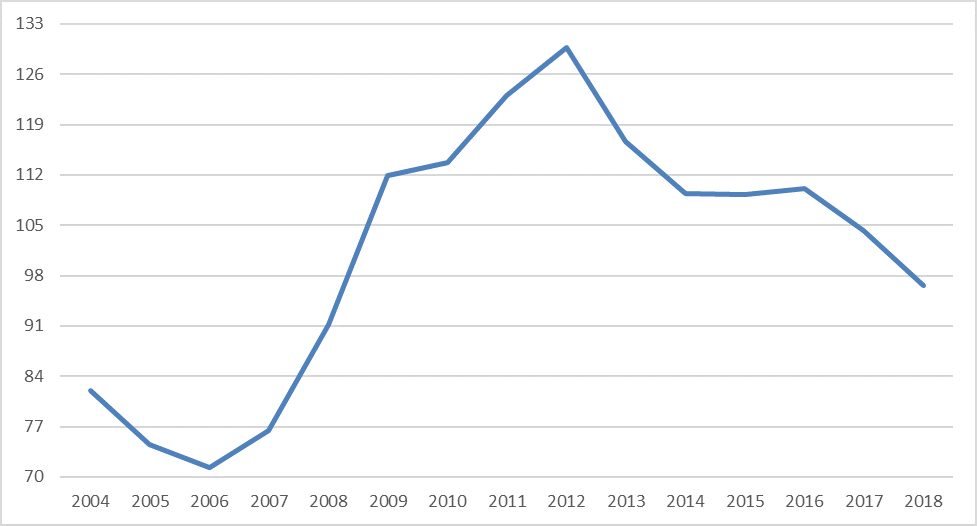
Potential homebuyers also face a supply challenge at the lower or starter-priced end of the housing market. Inventory levels of starter-priced, single-family homes are low.5 Scarce inventory leads to higher prices, pushing some potential homebuyers out of the market. Indeed, the housing affordability index for first-time home buyers,6 recently fell below 100, meaning homes for first-time home buyers are relatively unaffordable—see chart.
Chart 1. First time home buyer affordability index (U.S.), 2004–2018
Renting
The next table looks at renting by income group (real household income) in Michigan. The renting share of households and the owning share sum to 100.
Table 4. Michigan rental rates (%) by real household income, 2009–2017
| Income group (000s) | 2009 | 2010 | 2011 | 2012 | 2013 | 2014 | 2015 | 2016 | 2017 |
|---|---|---|---|---|---|---|---|---|---|
| <$10 | 62.7 | 63.4 | 63.7 | 64.0 | 63.9 | 64.2 | 63.6 | 62.8 | 62.2 |
| 10-25 | 44.8 | 45.5 | 46.4 | 47.2 | 47.7 | 48.1 | 49.0 | 49.1 | 50.3 |
| 25-35 | 33.3 | 33.7 | 34.4 | 34.4 | 35.6 | 36.2 | 36.8 | 37.8 | 38.4 |
| 35-50 | 24.9 | 24.8 | 26.5 | 26.7 | 27.4 | 29.0 | 29.5 | 30.2 | 31.2 |
| 50-75 | 16.8 | 17.2 | 17.4 | 18.2 | 18.9 | 20.4 | 21.2 | 22.7 | 23.8 |
| 75-100 | 9.6 | 9.9 | 10.7 | 11.3 | 12.7 | 13.4 | 14.6 | 15.1 | 15.7 |
| 100-150 | 4.9 | 6.1 | 6.7 | 6.8 | 8.3 | 8.7 | 9.1 | 10.1 | 10.7 |
| >150 | 3.4 | 3.1 | 5.3 | 5.5 | 4.6 | 5.6 | 6.2 | 6.5 | 6.5 |
It appears that more households are opting to rent versus own because it makes more sense financially. The percentage of households renting in the top two income groups also increased—likely including some younger households that prefer renting,7 as well as older households that are downsizing.
Conclusion
Homeownership rates in Michigan are still lower than in the early 2000s for all household income groups, except the lowest one. However, the level of Michigan households in the top two income groups that own homes has increased. And more Michigan households opted to rent between 2009 and 2017. While the housing market continues to reset itself after the housing bubble, the market is also experiencing other structural challenges, such as an aging population potentially looking to downsize and higher levels of student loan debt and other factors leading younger workers to rent longer. As one of the older states demographically, Michigan is especially vulnerable to these structural challenges in the housing market.
Notes
1 In 2004, the U.S. homeownership rate was 69%, in Michigan, 77.1% Michigan’s homeownership rate actually reached 77.2% in 2001.
2 See p. 2 of this document.
4 See p. 12-18 of this document.
6 For methodology, see this article.


