Population Ranks of Midwest Cities
Have you ever heard of Zipf’s Law? I’ll bet you haven’t. Zipf’s Law states that there typically appears to be a numerical regularity between the population size and population rank of cities within any particular region or nation. Specifically, within a region or nation, multiplying any city’s population size by its rank among cities will yield a constant number throughout the distribution. For instance, if the most populous city in a nation has a population of 10 million, the constant should be 1.0 multiplied by 10 million; the second largest city should have a population of 5 million so that 2 times 5 million yields 10 million once again; and so on.
As a fun way to display the size distribution of metropolitan areas in the Great Lakes, we tried to fit Zipf’s Law to the size distribution of metropolitan areas for the (census) year 2005. Guess what? We found that Zipf’s Law nailed it.
For the statistical trial, we chose the Great Lakes region which is defined by the Bureau of Economic Analysis as the states of Ohio, Michigan, Indiana, Illinois and Wisconsin. As it turned out, and as shown in the chart below, Zipf’s regularity applies very closely to the population distribution of Great Lakes metropolitan areas.
My prior thinking was that this region, which we think of as the industrial belt, was a cohesive economic region with close ties among firms and workers. In fact, there is no economic theory at all behind the Zipf’s Law and its relationship between population size and rank. Yet, in choosing a region, I thought it to be a promising trial to choose a region in which we might expect to find the statistical regularity if it was undergirded by economic linkages.
Figure 1. Metropolitan statistical areas with principal cities in IL, IN, MI, OH, WI: 2005
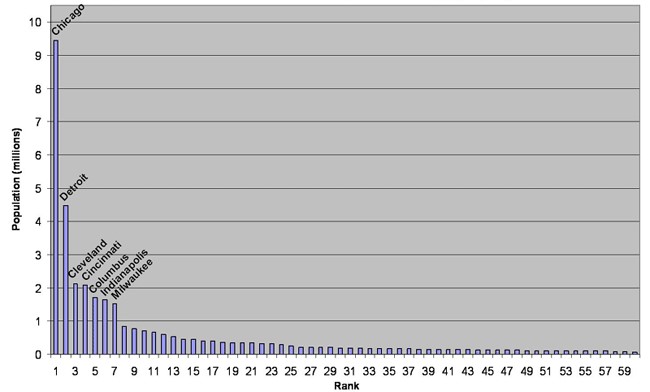
Table 1. Metropolitan statistical area by regional population rank
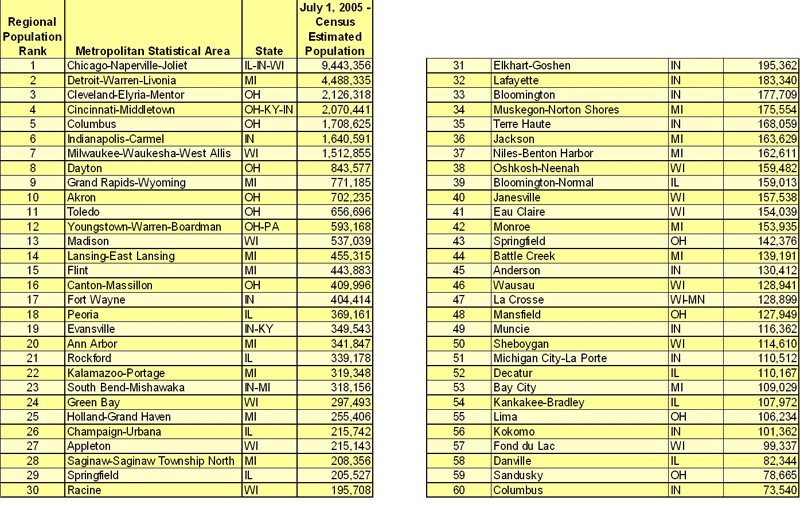
In the rank distribution, the Chicago metropolitan area leads the pack with approximately 9.4 million. The Detroit area comes in second with, as might be expected, a population of one-half of Chicago’s at 4.5 million. The third metropolitan area, Cleveland, does not quite fit, dropping down too far with a population at just over 2 million. Still, the remaining distribution fits well enough so that G. K. Zipf’s regularity retains our fascination.
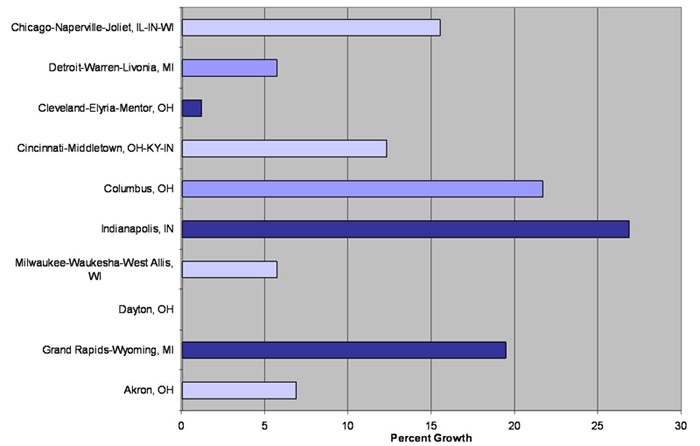
Perhaps it is only the statistical geeks among us who love this sort of analysis. Still, almost everyone loves a good horse race. So, for the rest of you, here is a comparative graph of the population growth for the top 10 most populous Great Lakes metropolitan areas from 1990 to 2005. And the winner is … Indianapolis, with a population growth of 27 percent , 346 thousand. What a town!
Figure 2. Population growth rates of 10 largest metropolitan statistical areas in IL, IN, MI, OH, WI: 1990-2005