Manufacturing exports continue to excel
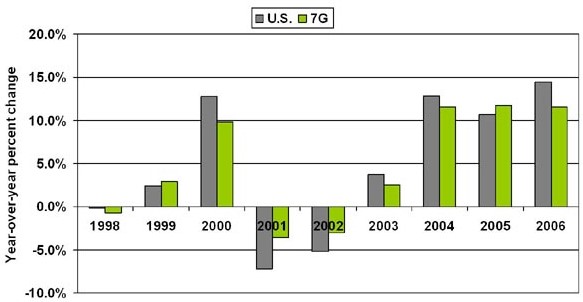
Even as much of the Midwest’s automotive industry remains troubled, the region’s overall manufacturing exports continue to impress. In the Seventh District, manufactured exports make up around 7% of gross state product; this is on par with the nation’s economy (also discussed in a previous blog). While this share is not huge, the manufacturing sector’s rapid growth of exports in recent years translates into an outsized contribution to the region’s growth. Export growth of manufactured products will exceed 11% in 2006, which marks the third consecutive year of similar growth. By our reckoning, strong export growth from manufacturing made up roughly one-sixth of the Seventh District’s overall output growth in 2006.
Figure 1. Manufacturing exports
What’s propelling these exports? For the most part, it’s been due to continued strong global economic recovery and expansion. Following two years of weak growth in 2001 and 2002, the global economy began to recover. According to estimates gathered and reported by the IMF, the global economy grew by 5.1% in 2006. This followed three years of similarly strong expansion. As of early 2007, forecasts and expectations for this year are equally robust.
Among our major trading partners, Mainland China has exhibited the strongest growth; it has been reporting growth rates of 8% to10% over the past seven years. Accordingly, Seventh District manufacturing exports to China have been growing rapidly at an average annual pace of 9.3% per year since 1997.
The chart below illustrates that Midwestern exports to China have come to represent an increasing share of the region’s overall exports to Asia. In 1997, overall goods exports to China, including agriculuture, mining, and manufacturing, accounted for only 13.7% of the Seventh District’s exports to Asia. By last year, however, China’s share almost reached 20 percent. (See black line).
Manufactured goods exports accounted for most of this expansion. Moreover, expanding manufactured exports were widespread across broad industry sectors including transportation equipment, machinery and metals.
The second chart below ranks manufactured exports to destination nations in 1997 and 2006. While Canada remains far and away the region’s predominant export destination, China now ranks fifth, behind Canada, Mexico, the U.K., and Japan. The Seventh District states exported $4.9 billion of manufactured goods to China-Hong Kong last year.
Figure 2. China share of exports to Asia from Seventh District states
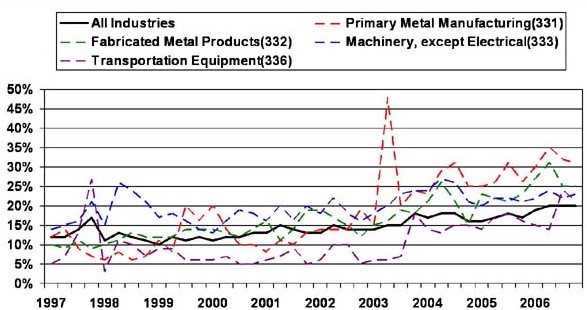
Note: "China" comprises Mainland China and Hong Kong. "Asia" comprises the Asian continent, including Turkey.
Table 1. Leading Seventh District manufacturing export destinations ($millions, 2006=100)
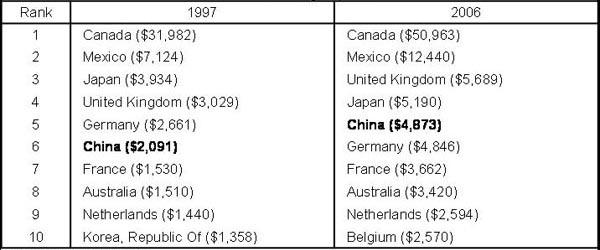
Note: "China" comprises Mainland China and Hong Kong.
Table 2. Leading U.S. manufacturing export destinations ($millions, 2006=100)
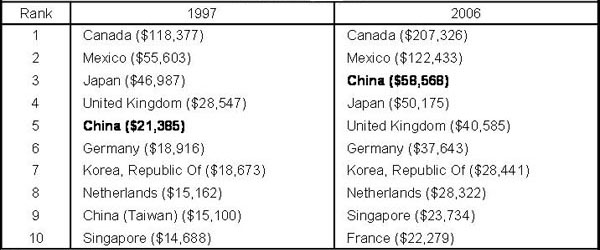
Note: "China" comprises Mainland China and Hong Kong.
The Seventh District’s manufacturing sector continues to be large and export oriented. This means that global economic growth will continue to figure prominently in the region’s growth. However, this assumes that U.S. policies of open world trade and investment will continue to be expanded. Agreements to open our trade across the globe help develop and stimulate the economies of our trading partners. In response, our trading partners turn to the industrial Midwest for many of their purchases.


