District Population in 2010
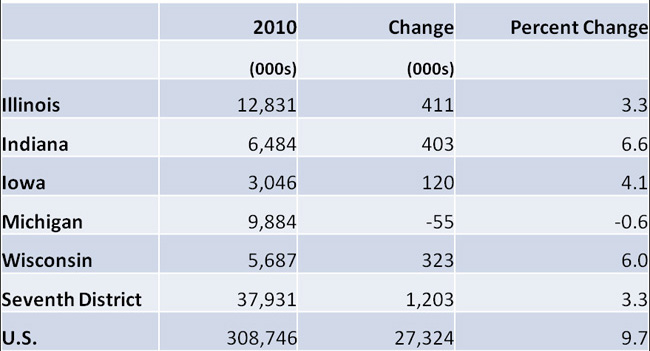
With much fanfare, the Census Bureau released its first population estimates from the 2010 census for the nation and the states. Per the table below, population in the five states of the Seventh District grew by 3.3 percent, or 1.2 million people, since the last national census was conducted in the year 2000. The average masks sharp differences among the states of the Seventh District. Michigan was the only state in the nation to experience an overall decline in population this past decade—its population shrank by more than one-half percent. The other District states experienced population gains ranging from 3.3 percent in Illinois to 6.6 percent in Indiana. In comparison, total U.S. population grew by 9.7 percent.
Table 1. Population change: 2000-2010
A comparison of District population growth over the past decade with the decade of the 1990s reflects hard times in Michigan and, to a lesser extent, in Illinois. During the 1990s, Michigan population grew at about one-half the pace of the nation. At that time, a resurgent automotive sector produced SUVs, small trucks, and mini-vans during a decade of low gasoline prices and buoyant overall U.S. automotive sales.
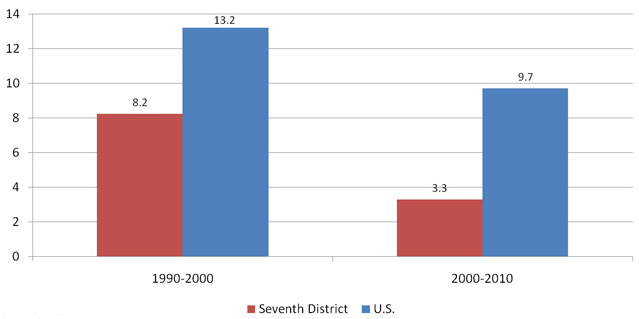
Illinois’s economy and population also grew rapidly during the 1990s, with population growth exceeding 8 percent. In contrast, population growth reached only 3.3 percent during the recent decade. The Chicago area economy was hit hard by the large downdraft in telecommunications production early in the decade, as well as the sharp decline in travel that was precipitated by the terrorist attacks of September 11, 2001. In this climate, Chicago’s producer and business services recovered very slowly following the 2001 recession.
Iowa’s population grew by only 4.1 percent since 2000. However, this pace represents only a modest slowdown from the state’s 5.4 growth during the 1990s. Slow population growth in Iowa reflects the state’s high concentration in production agriculture and its less urbanized population. The state has enjoyed an unemployment rate below the national average since the mid-1980s.
Due their subpar population growth, Iowa, Michigan and Illinois will each lose one Congressional representative following the 2012 national elections. Following the year 2000 census, each state of the District lost one representative with the exception of Iowa, which remained the same.
Note: Thanks to Britton Lombardi for assistance.
Figure 1. Percent change in population: Illinois

Figure 2. Percent change in population: Indiana
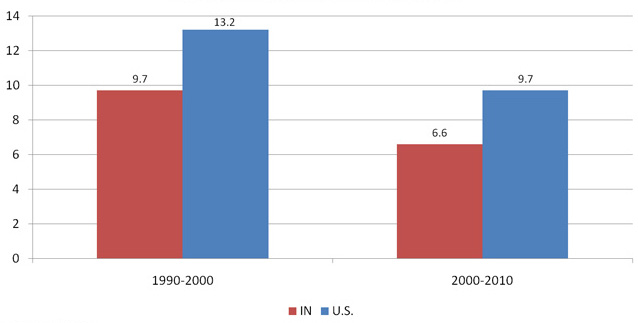
Figure 3. Percent change in population: Iowa
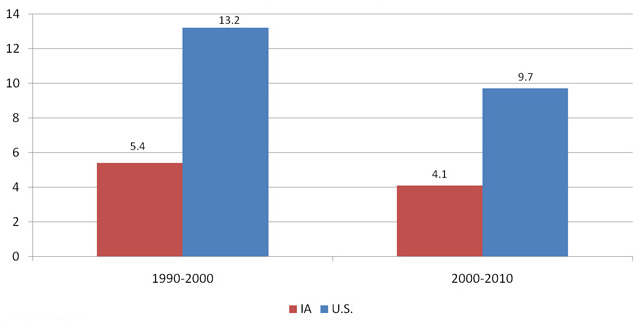
Figure 4. Percent change in population: Michigan
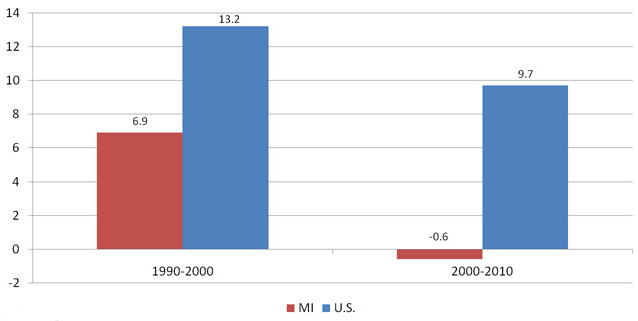
Figure 5. Percent change in population: Wiconsin
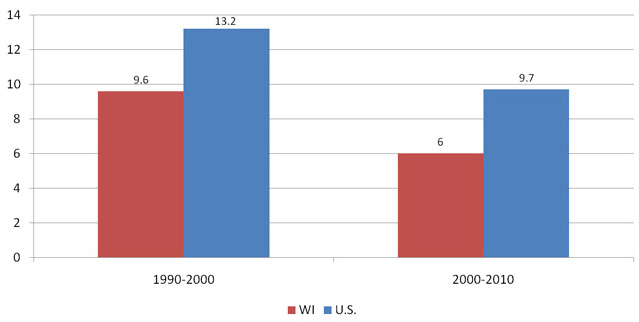
Figure 6. Percent change in population: Seventh District