Watching for Job Rebounds
According to economists’ reckoning, the recession very likely ended this past summer, meaning that the U.S.’s national output has begun to grow once again (from a deep trough). But for many households, the direction of recovery has much more to do with job growth, job opportunities, and hours worked. And so, the job watch is on. We continued to lose jobs during 2009, but employment is expected to begin to grow again by mid-year 2010. At some point soon, businesses will no longer be able to expand their production of goods and services without hiring. In anticipation, analysts and some households alike are watching current indicators of labor market activity, such as monthly payroll job counts, along with early or leading indicators of labor market turnaround that might foreshadow rising job opportunities.
There are several such indicators available to states and regions. As a measure of current net job growth, the Bureau of Labor Statistics (BLS) releases state estimates with a three-week lag from the previous month, and metropolitan area estimates with a four- to five-week lag. Recent total nonfarm payroll job trends (below) show that job growth in the U.S. has generally been stronger than in the Midwest (and declines have been more severe).
1. U.S. employment services payroll employment (thousands)
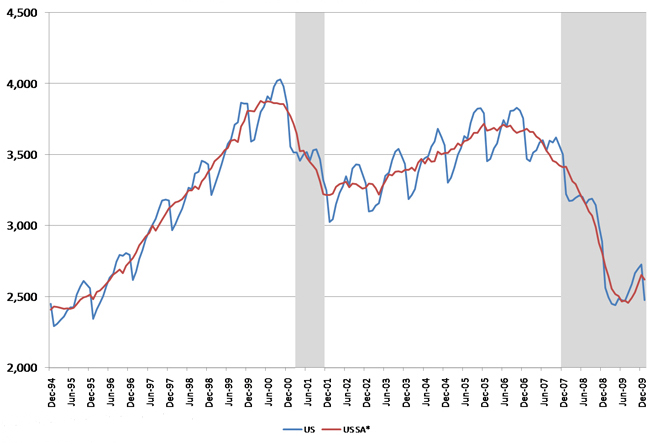
Source: BLS/Haver Analytics.
Estimates of total payroll employment are derived from a sample of business establishments that report on employees, hours, and earnings of their workers. The estimates are revised one month following their initial release to include information from late-reporting firms. Since the estimates are based on just a sample of firms, they are also benchmarked (once per year) to a near-universe of business establishments. For example, BLS reports that “the average absolute benchmark revision at the state total nonfarm (jobs) level was four-tenths of a percent (0.4%) in March 2008. The range of percentage revisions across states were –2.8 percent to 1.5 percent.”
Given such imperfections in accuracy and timing, alternative indicators are eagerly watched, especially if they have exhibited some previous power in “leading” or predicting past job market turnarounds.
Among the most timely current indicators is “initial claims for unemployment insurance”. After a one-week “waiting period,” newly terminated workers may file for umemployment insurance (UI). These claims are compiled weekly at the state level and reported in a news release by the U.S. Department of Labor. UI claims are an incomplete picture of the job market in several ways. For one, not all workers are covered by, or eligible for, UI insurance. But most importantly, from a conceptual standpoint, UI claims reflect only “job destruction” and not “job creation.” Newly hired workers are not counted in this administrative-type data.
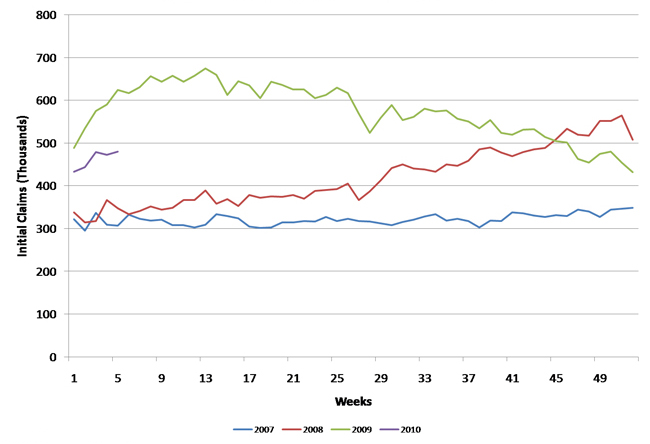
For the U.S. overall, UI claims have generally been falling. Initial UI claims peaked above a weekly average of 650,000 (seasonally adjusted) for March of 2009. By January of 2010, UI claims had fallen to 467,000. Still, these numbers remain higher than in the recent past. For all of 2007, UI claims averaged 322,000 per month.
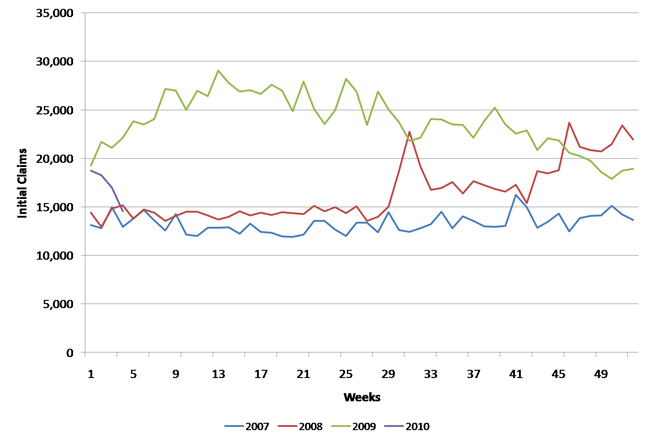
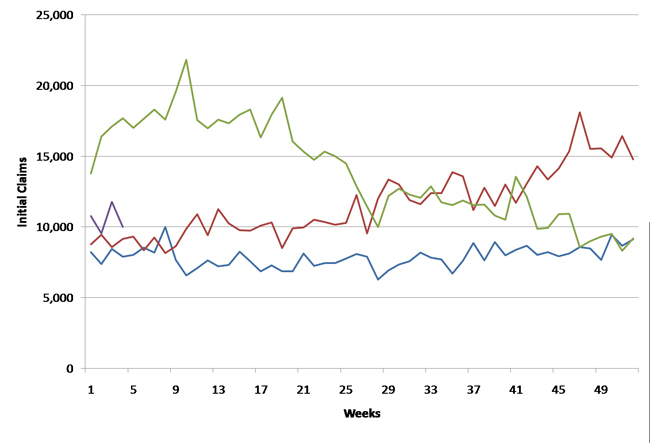
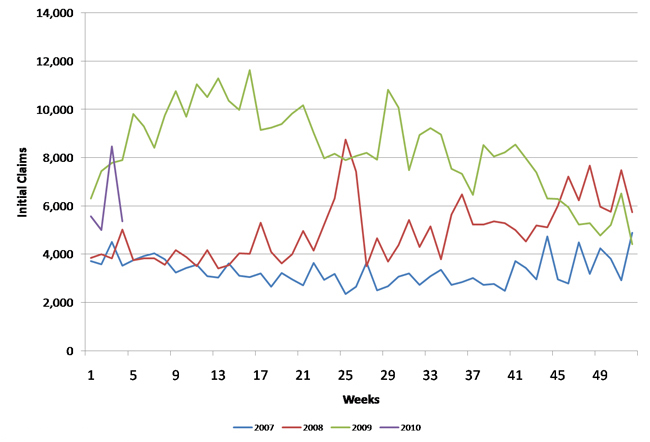
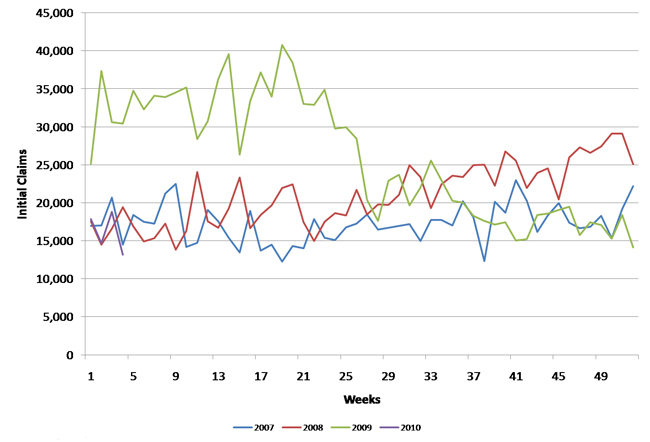
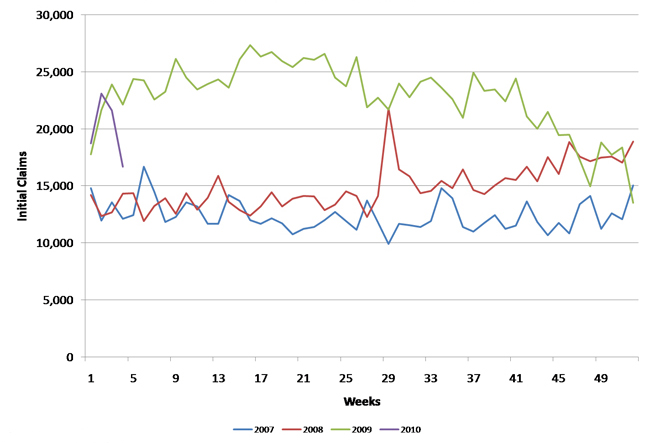
The charts below illustrate the recent labor market improvement, as measured by initial UI claims, for the Seventh District states of Illinois, Indiana, Iowa, Michigan, and Wisconsin.1
The lines show the time path of UI claims filed for each of the years 2007–09 and January of this year.
State experiences have varied somewhat, though with a similar general pattern. All states experienced a significant surge in claims during the second half of 2008 (blue line), especially during the fourth quarter. Job destruction worsened into the first half of 2009 (red line). But by the fourth quarter of 2009, UI claims had fallen below those of 2008 in every District state. Nonetheless, for the fourth quarter of 2009 and into the first month of January, UI claims in Iowa, Wisconsin, and Illinois remained well above those experienced during in the same period in 2007.
2. U.S. unemployment insurance initial claims, S.A.
3. Illinois unemployment insurance initial claims, S.A.
4. Indiana unemployment insurance initial claims, S.A.
5. Iowa unemployment insurance initial claims, S.A.
6. Michigan unemployment insurance initial claims, S.A.
7. Wisconsin unemployment insurance initial claims, S.A.
Other indicators also help to presage rising job creation. Observations of “help wanted advertising” measure the demand for labor, indicating soon-to-be-filled employment transactions. The Conference Board tracks national and state online job vacancies on a monthly basis. Their recent release reports a third consecutive month of strong national gains in advertised vacancies. The gains were widespread across U.S. regions, including the Midwest. Ohio was among those states recording the strongest January over December gain since the data series began in 2005. Seventh District states Illinois, Michigan, and Wisconsin all recorded monthly gains of 10 percent or more.
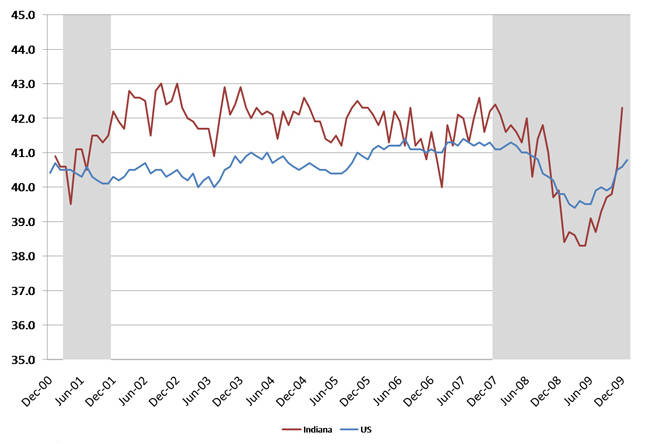
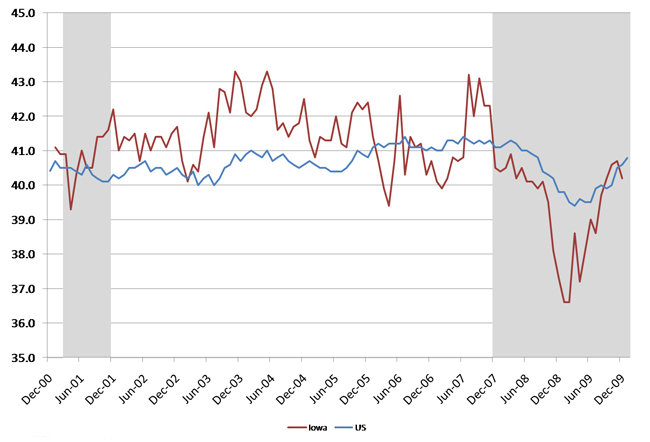
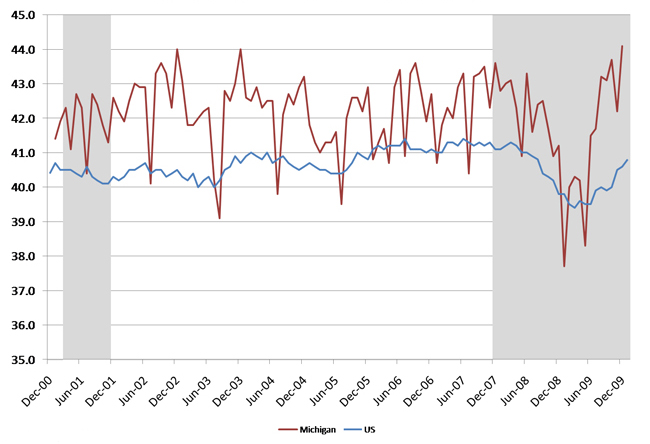
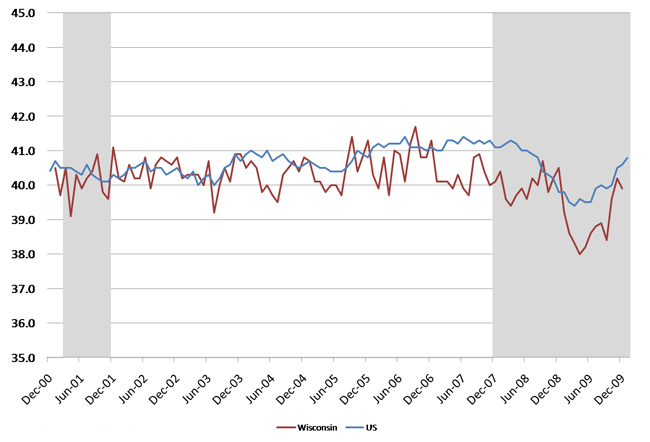
Analysts also follow the “contingent worker” or so-called temporary help employment series to foreshadow an eventual upswing in total nonfarm employment. In situations where general business conditions are improving but still somewhat weak, and before employers are willing to commit to permanent hiring, firms may begin to contract for workers from specialized employment services firms. Employment at such firms is sufficiently prevalent in four of our District states so that monthly data are reported by the BLS. As shown below (red line), employment of temporary workers grew in the second half of 2009 in Michigan, Indiana, Illinois, and Wisconsin.2
8. U.S. employment services payroll employment (thousands)
Source: BLS/Haver Analytics.
9. Illinois employment services payroll employment (thousands)
Source: BLS/Haver Analytics.
10. Indiana employment services payroll employment (thousands)
Source: BLS/Haver Analytics.
11. Michigan employment services payroll employment (thousands)
Source: BLS/Haver Analytics.
12. Wisconsin employment services payroll employment (thousands)
Source: BLS/Haver Analytics.
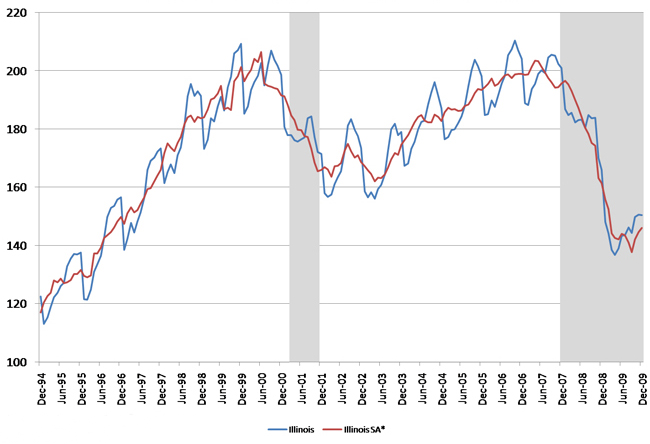
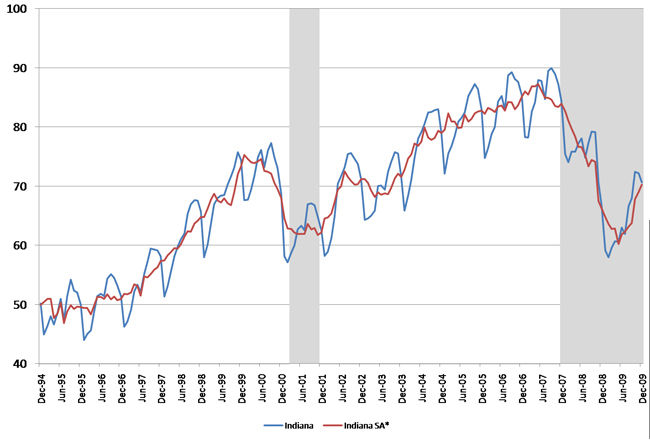
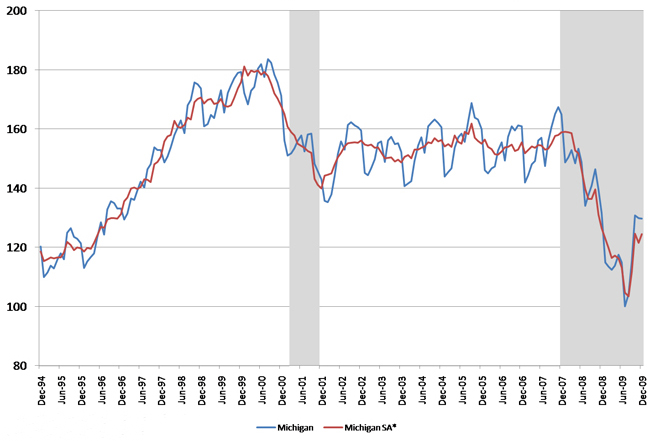
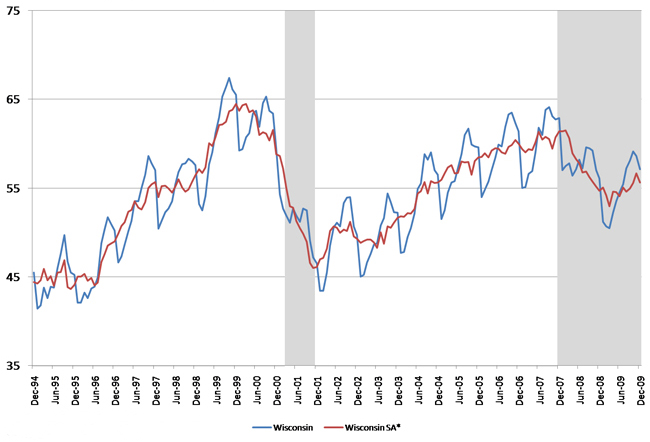
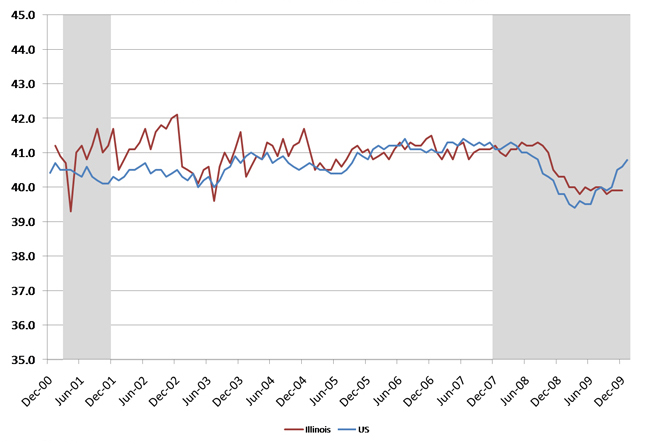
As another measure of potential labor market tightening, the BLS also reports average weekly hours worked of production and nonsupervisory workers for states and metropolitan areas. During slack production times, firms may choose to ratchet back their employees’ hours rather than to lay them off entirely. If so, once production begins to pick up, and before any new hiring takes place, firms will tend to add back work hours for existing employees. Currently, the BLS reports these data for manufacturing workers only.
As seen in the charts below, average weekly hours worked has begun to rise in the U.S. (blue line) and in each District state (red line) except Illinois. Though the manufacturing sector has experienced sharp declines over the past two years, it has begun to recover early in the aftermath of the 2008–09 recession.
13. Illinois average weekly hours: manufacturing
14. Indiana average weekly hours: manufacturing
15. Iowa average weekly hours: manufacturing
16. Michigan average weekly hours: manufacturing
17. Wisconsin average weekly hours: manufacturing
Local chapters of the Institute of Supply Management (ISM) also track manufacturing employment through their monthly survey of purchasing managers. ISM Indices are directional only (they do not measure levels), indicating expansion versus contraction of various categories of business activity at their establishments. A reading of 50.0 indicates that, during the previous month, activity was equally balanced between expansion and contraction; readings above 50.0 indicate a greater reported tendency of establishments to expand. The Chicago ISM survey reported at the end of January (for December) that its reading on employment “leapt to the highest level in nearly five years.” In contrast, the ISM survey for Southeast Michigan reported “declines for the third straight month, continuing its downward spiral to (a reading of 36.0).
What to make of these many indicators? An understanding of the wide array of labor market indicators can provide both workers and the unemployed with a better “read” on when labor market opportunities are arising or when they will improve in their region. In contrast, the most followed labor market indicator, local unemployment rates, can be misleading. As more jobs open up, some workers who have been waiting on the sidelines (and not hunting for jobs) will actively seek employment once again. Once they are actively looking, the survey from which the unemployment rate is calculated begins to count them as “unemployed,” thereby raising the unemployment rate even as net job growth is taking place.
And so, in the coming months, the unemployment rate in both District states and the U.S. may continue to climb, even as the labor market situation may be improving in some locales and industry sectors.3
Footnotes
1 It is also possible to gather UI claims at the local level of geography. For example, initial claims for metropolitan areas are gathered and reported in Ohio.
2 These data are also reported for metropolitan areas. These data are also subject to annual revision in March of every year. The data are benchmarked to March of the previous year and projected forward from that benchmark. Hence, the data are re-benchmarked once again the following year, once another benchmark is established.
3 Both the Bureau of Labor Statistics and state and local government agencies provide additional indicators for specific occupations, industry sectors, and local areas.


