What’s behind the large and rapid gains in Midwest farmland values?
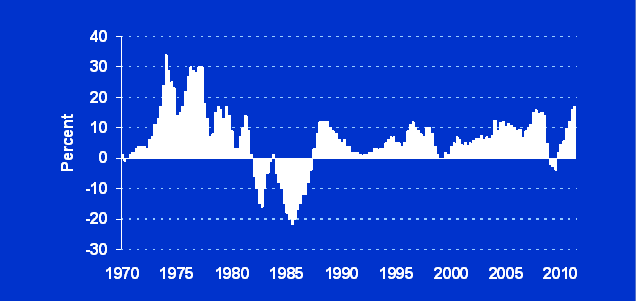
Rapid increases in the value of Midwest farmland have contrasted sharply with the malaise of other real estate markets. At 17% (see chart), the year-over-year increase in the value of farmland in the Seventh Federal Reserve District for the second quarter of 2011 was the largest recorded since the 1970s, according to a survey conducted by the Chicago Fed and reported in the latest issue of AgLetter. Agricultural land values in Indiana and Iowa climbed 20% or more in a year, while agricultural land values in Illinois climbed almost as much. “Good” agricultural land in the Seventh District rose 4% in the second quarter of 2011 relative to the first quarter of 2011. Bankers in the survey commented that there were more summer auctions of farmland than usual, particularly as demand for farmland remained strong from both farmers and investors. Some bankers expressed concerns about the risks facing farmland markets, especially with regard to declines in crop prices. However, these views formed a minority, as just 2% of responding bankers expected farmland values to fall in the third quarter of 2011 (36% of survey respondents anticipated higher farmland values in the third quarter, and 62% expected no change).
On November 15, 2011, the Federal Reserve Bank of Chicago will hold a conference to explore the factors contributing to these large increases in midwestern agricultural land values and associated cash rental rates. At the conference, experts from academia, the farm industry, and policy institutions will present research on the causes of rapid increases in agricultural land values and cash rents, as well as their interrelationship. The goals of the conference include analyzing demographic and geographical characteristics of Midwest farmland ownership; understanding the dynamics of farmland valuations; assessing the risks facing agriculture and the banking industry from rising farmland values; and discussing policy implications for agricultural lending stemming from current farmland trends. Visit here for additional details.
A report on agricultural land values from the U.S. Department of Agriculture showed similar increases for 2011, as of January 1. There was a 16.2% gain on an acre-adjusted basis for the five Seventh District states from the start of 2010 to the start of 2011, calculated from data in the USDA report. Furthermore, there have been large increases according to surveys in Indiana and Illinois. Wisconsin farmland values have risen too, although not as quickly.
Recent data from the Iowa Farm and Land Chapter #2 of the Realtors Land Institute confirmed that farmland values continued their fast ascent in Iowa. The institute’s survey results indicated that there was a 12.9% jump in Iowa’s agricultural land values between March and September of 2011. Further information about Iowa’s farmland is available from an annual survey conducted by Iowa State University. Michael Duffy from Iowa State University will present on the demographics of farmland ownership at the Chicago Fed conference.
By the end of this year, net farm income for 2011 is projected to have risen $24.5 billion from that of 2010, to $103.6 billion, according to the latest USDA forecasts. This estimated rise in net farm income should help propel farmland values upward even further. This forecasted rise in net farm income is due to anticipated increases of $34.7 billion in the value of crop production and $22.7 billion in the value of livestock production, even though the cost of purchased inputs is projected to rise $28.0 billion. Government payments were forecasted by the USDA to decrease 18% from 2010—to $10.2 billion for 2011.
Higher crop prices have boosted the expected stream of earnings from crop production, supporting further gains in farmland values. According to data from the USDA, crop revenue for 2010 in the Seventh District jumped 34% above that of 2009, despite below-trend corn yields. The Seventh District value of corn for grain produced in 2010 was $31.8 billion, and the value of soybeans was $16.6 billion. In 2011, corn and soybean prices have kept well above the levels of a year ago. Relative to a year earlier, September corn prices were 49% higher and soybean prices were 27% higher, even though crop prices have fallen from summer highs.
The USDA estimated that the nation’s 2011 harvest of corn for grain will be slightly smaller than the 2010 harvest. It also estimated that the five Seventh District states’ 2011 harvest of corn for grain will be 2.4% larger than the previous year’s harvest. Soybean production was estimated to decline 8.1% for the U.S. and 9.9% for the five Seventh District states. Total usage of corn, at 12.7 billion bushels, would result in U.S. ending stocks of 866 million bushels—the tightest in 15 years. Total soybean usage in the U.S. of 3.13 billion bushels would leave ending stocks at 160 million bushels, tighter than a year ago. The USDA estimated price intervals for the 2011–12 crop year of $6.20 to $7.20 per bushel for corn and $12.15 to $14.15 per bushel for soybeans. Based on the midpoints of these projected price ranges, the value of the Seventh District corn crop in the current year would rise 25% from 2010, while the value of the soybean crop would decline almost 1%.
In addition, livestock prices were well above the levels of 2010 in September 2011. Prices for hogs, cattle, and milk were 9.6%, 17%, and 18% higher this September than last September, respectively. The livestock sector has experienced higher revenues, but higher feed costs have limited the rise in income for the sector. The combination of higher revenues for crop and livestock production has been an impetus for the significant increases in agricultural land values seen this year in the Seventh District.
According to the AgLetter covering the first quarter of 2011, farmers tended to outbid investors for agricultural land at auctions, some respondents reported. Although investors often bowed out in the bidding, they are showing growing interest in farmland. This should not be too surprising given the mixed results other investments have been generating in recent years. Jennifer Ifft, a conference speaker, co-wrote a piece that examines the role of investors in California farmland markets. The reporting bankers in the Seventh District thought farmers bought an even higher share of farmland this year than during the prior year; 48% of the respondents saw an increasing share of land purchased by farmers and only 6% saw a decreasing share in the period from October 2010 through March 2011. With 75% of the bankers observing higher demand for the purchase of farmland and just 1% observing lower demand, the market for farmland was ripe for fast rising land values.
This summer there was a set of articles about agricultural land values published in Choices, which was designed to educate readers on farmland. Another good resource on farmland values, from Purdue University, provides an analysis of farmland values, co-written by Brent Gloy (also a presenter at the conference).
Rents for farmland headed up
Seventh District cash rental rates for agricultural land in 2011 rose sharply relative to 2010—the only year over the past five that had an increase of less than 7%. Seventh District cash rents climbed 16% from 2010. Cash rental rates were up 14% in Illinois, 15% in Indiana, 16% in Iowa, 18% in Michigan, and 20% in Wisconsin. After being adjusted for inflation using the Personal Consumption Expenditures Price Index, Seventh District cash rental rates increased 14% from 2010. This increase was the second largest, behind that of 2008, since tracking of Seventh District cash rents began in 1981.
USDA results on cash rents for cropland showed an increase of 8.8% nationwide for 2011, as of January 1. Cash rents in the Seventh District rose 8.3% in Illinois, 7.8% in Indiana, 11% in Iowa, 12% in Michigan, and 7.6% in Wisconsin.
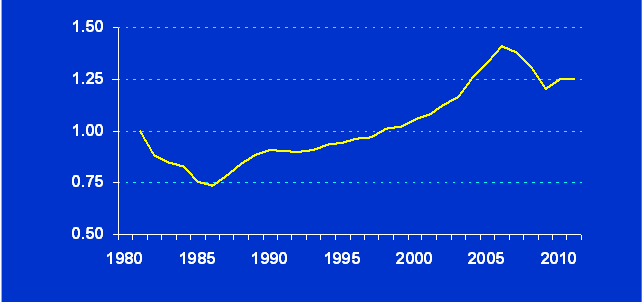
With the increase in Seventh District farmland values matching that for cash rental rates for 2011, there was no change in the price-to-earnings (P/E) ratio for Seventh District agricultural land (see chart). The unchanged P/E ratio indicated relatively balanced demand to purchase versus rent farmland. In an asset valuation model, the present price of an asset should reflect both current profitability and expectations for future earnings. The P/E ratio for farmland can be constructed as the ratio of indexes based on average farmland values per acre and cash rental rates per acre (the latter representing the earnings potential of farmland). Both cash rental rates and farmland values have risen because of higher agricultural prices.
Cash-renting agricultural land, although increasingly with clauses that allow owners to benefit when crop prices increase further, remained the dominant method (80%) in the Seventh District for farm operations by someone other than the owner. With 16% of farmland on crop shares, 1% on a bushel basis, and 3% on other arrangements, there appeared to be an inclination by owners to get more involved in farm operations and garner higher returns in 2011. Illinois remained the Seventh District state with the lowest percentage of cash rentals (68%), even as rentals on a crop share basis diminished (26%). Additional information on cash rental arrangements can be found from the University of Illinois.
Come join us on November 15, 2011, at the Federal Reserve Bank of Chicago to discuss these agricultural trends and the issues that they raise.
Charts:
1. Year-over-year changes in the farmland values of the Seventh District
2. Farmland price to earning ratio for the Seventh District (1981=1)