Farmers’ Markets and Local Foods Flourishing in the Midwest1
As Americans’ eating habits have evolved, so have our Thanksgiving feasts. Despite the holiday’s grounding in tradition, popular trends reinvent even the most common menu items. Cranberry sauce appeared on the American table after it was fed to Union troops during long stalemates of the Civil War.2 Whipped cream appeared ubiquitously on pumpkin pie after the handheld mixer became a mainstay in the American kitchen.3 Today, farmers’ markets and other direct channels are bringing local heritage turkeys to our dinner tables.
Likely, you have seen a farmers’ market pop up in your town square, neighborhood park, or in a vacant parking lot. Every week in over 6,000 neighborhoods across the countr y, people are going to farmers’ markets. Today there are over 4.5 times as many farmers’ markets throughout the U.S. as there were 20 years ago, according to the Agricultural Marketing Service (AMS) of the U.S. Department of Agriculture (USDA). Just in the past year, the number of farmers’ markets has increased 9.6% to a total of 7,864. Considering these numbers account for only documented markets, the actual numbers may be much higher.45
What is motivating this rapid growth? The popularity of farmers’ markets is more of a renewal than a new phenomenon. Vegetable and produce markets have been a mainstay of American communities from the beginning. America’s first recorded farmers’ market appeared in Hartford in 1643 as a mandate by the General Court of Connecticut. The farmers’ market was, in some senses, a precursor to nationhood.6
Today, policymakers, academics, and farmers alike are enthusiastic about the rural and community development potential of direct farm marketing. Thomas Vilsack, the Secretary of the USDA, proclaimed the nation’s first Farmers’ Market Week (August 5 to 11, 2012) “to further awareness of farmers’ markets and of the many important contributions farmers make to daily life in America….”7 Farmers’ markets have been touted as community revenue generators that simultaneously strengthen economic ties between metropolitan consumers and rural producers. Not to mention, they bring fresh vegetables, freshly baked breads, and sometimes home-made nonfood items, like soap and candles, to eager metropolitan patrons. The USDA estimated the U.S. local food market to be worth $4.8 billion in 2008, half as much as Starbucks’ entire international net sales in the same year.8
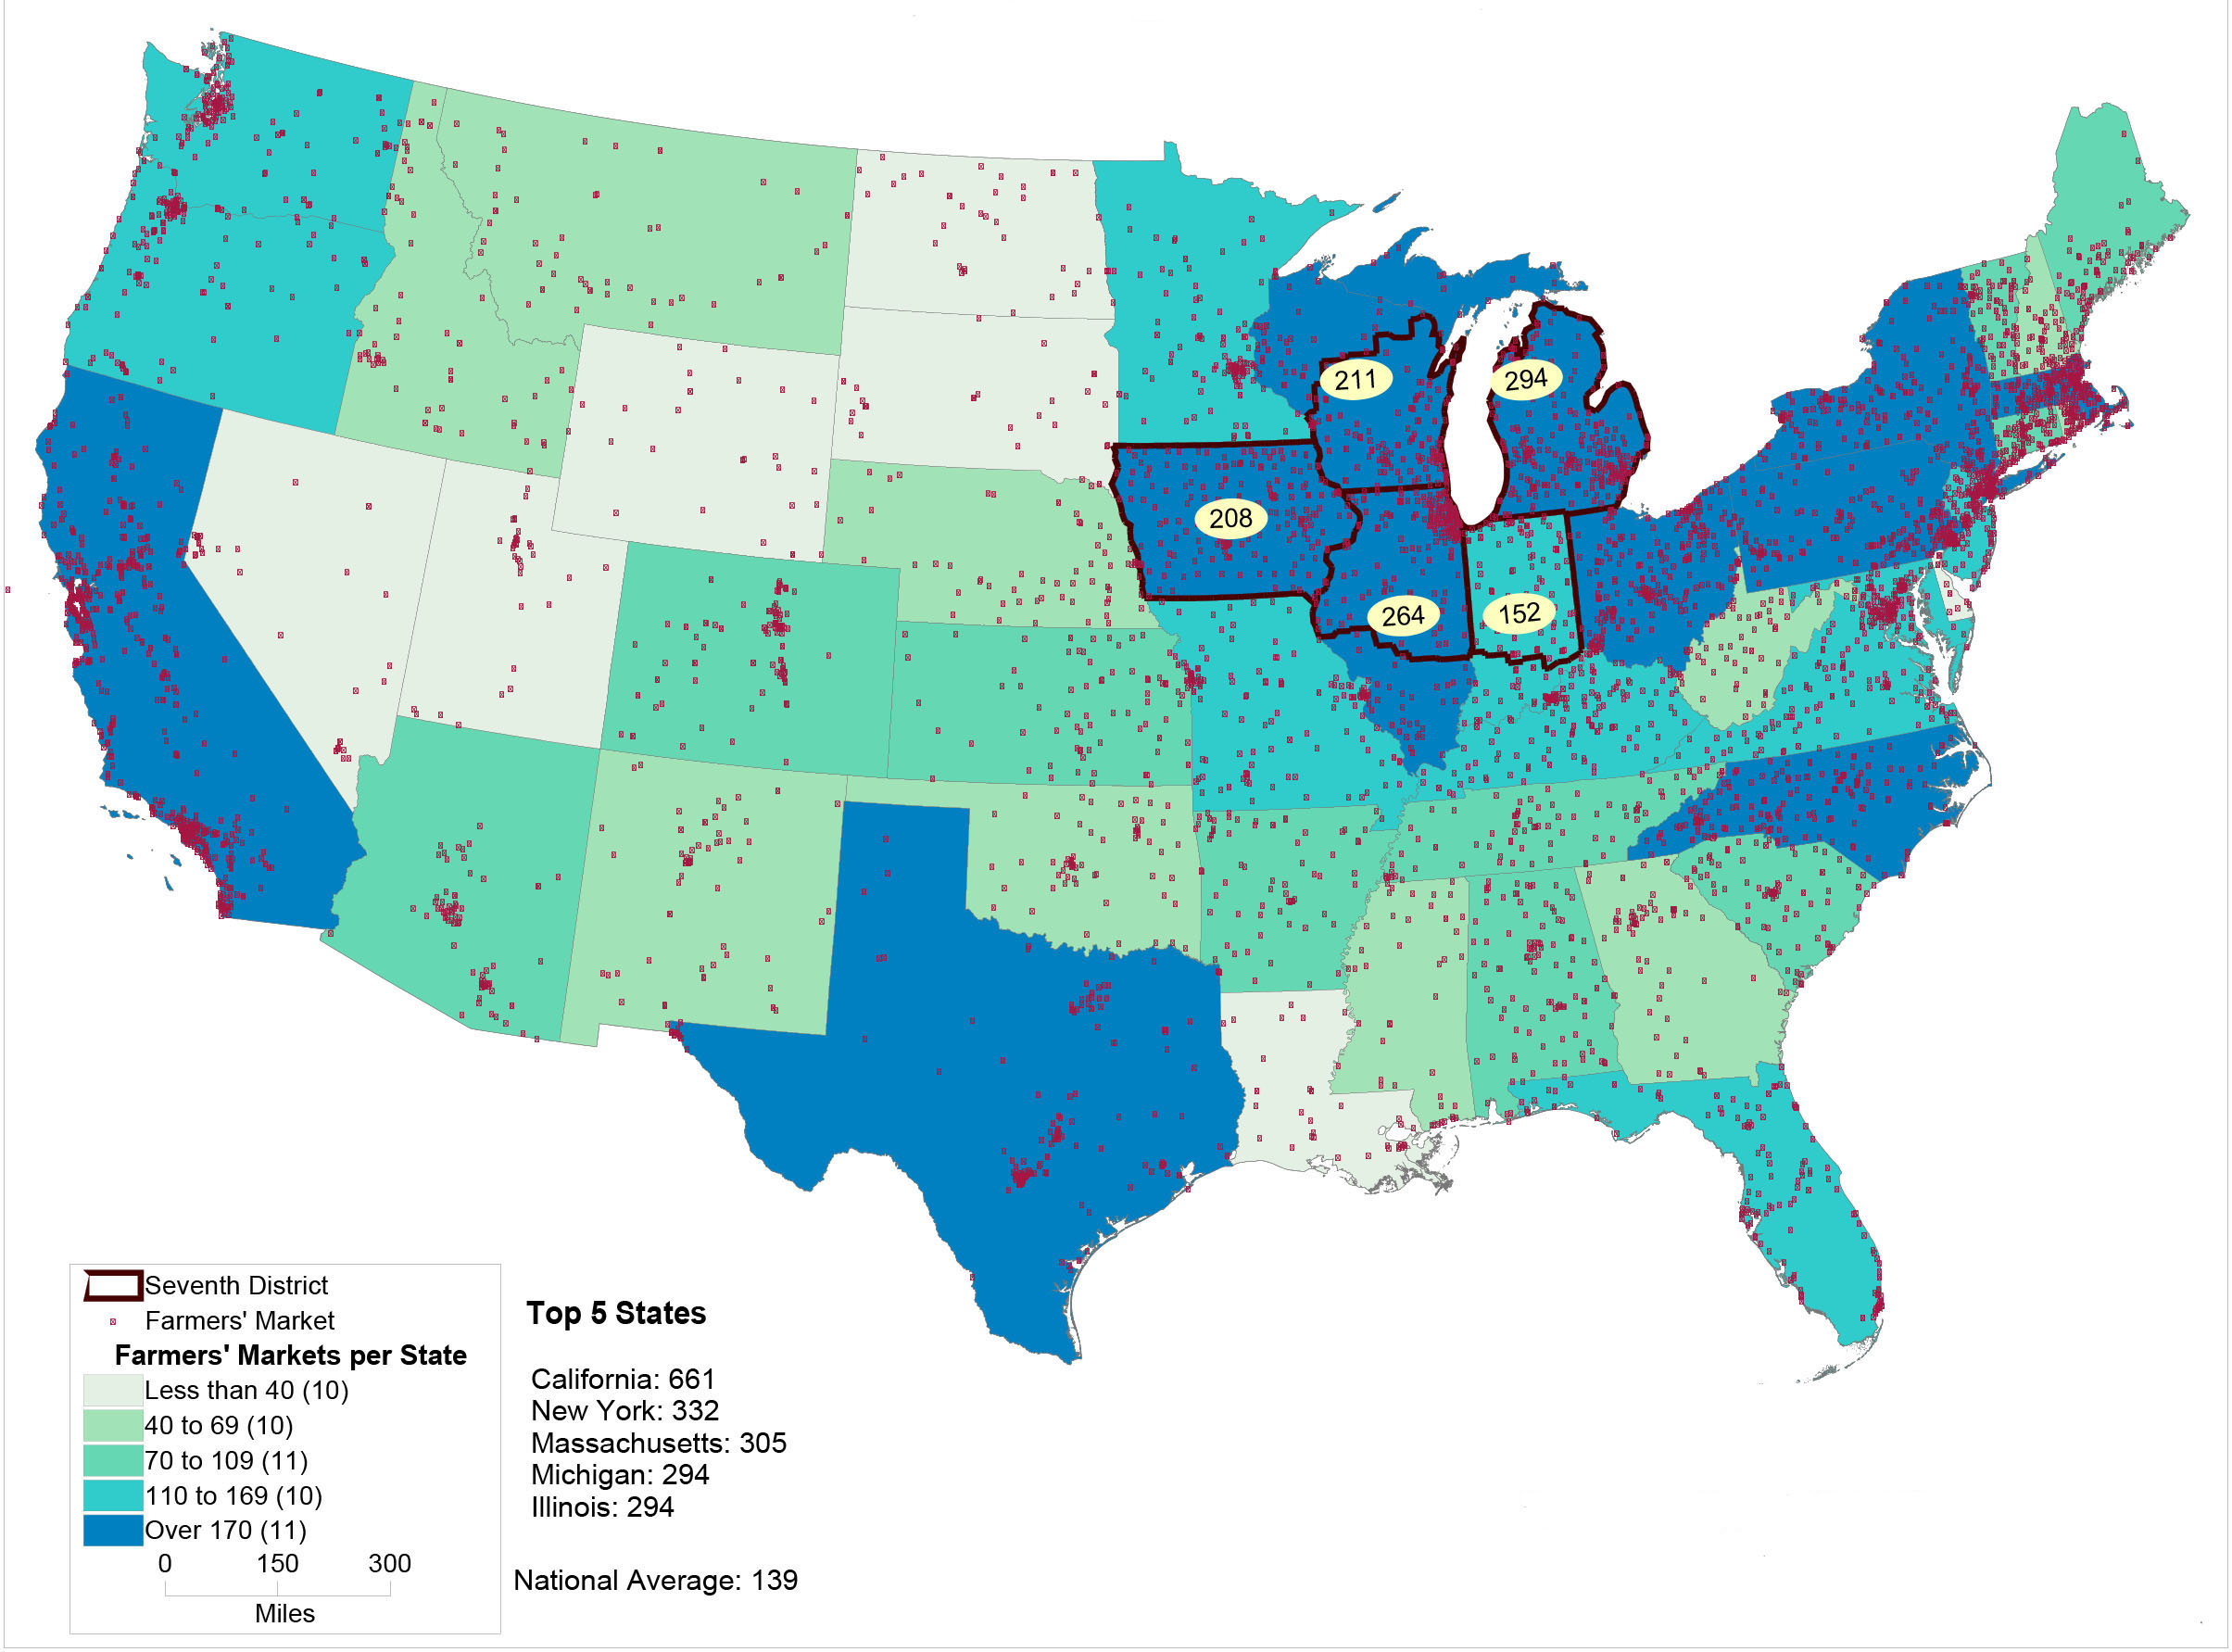
How do the five midwestern states of the Seventh Federal Reserve District9 measure up against the rest of the country in direct farm sales? Michigan and Illinois ranked fourth and fifth, respectively, among all 50 states for total farmers’ markets in 2012. Michigan has 294 documented farmers’ markets this year, while Illinois has 264. California, New York, and Massachusetts led the nation with 661, 332, and 305 farmers’ markets, respectively. All Seventh District states registered above the national average of 139 farmers’ markets per state. Indiana, Iowa, and Wisconsin reported 152, 208, and 211, respectively, as of 2012.
1. National Map of Farmers’ Market Locations and total markets per state as of July 2012
Created August 13, 2012
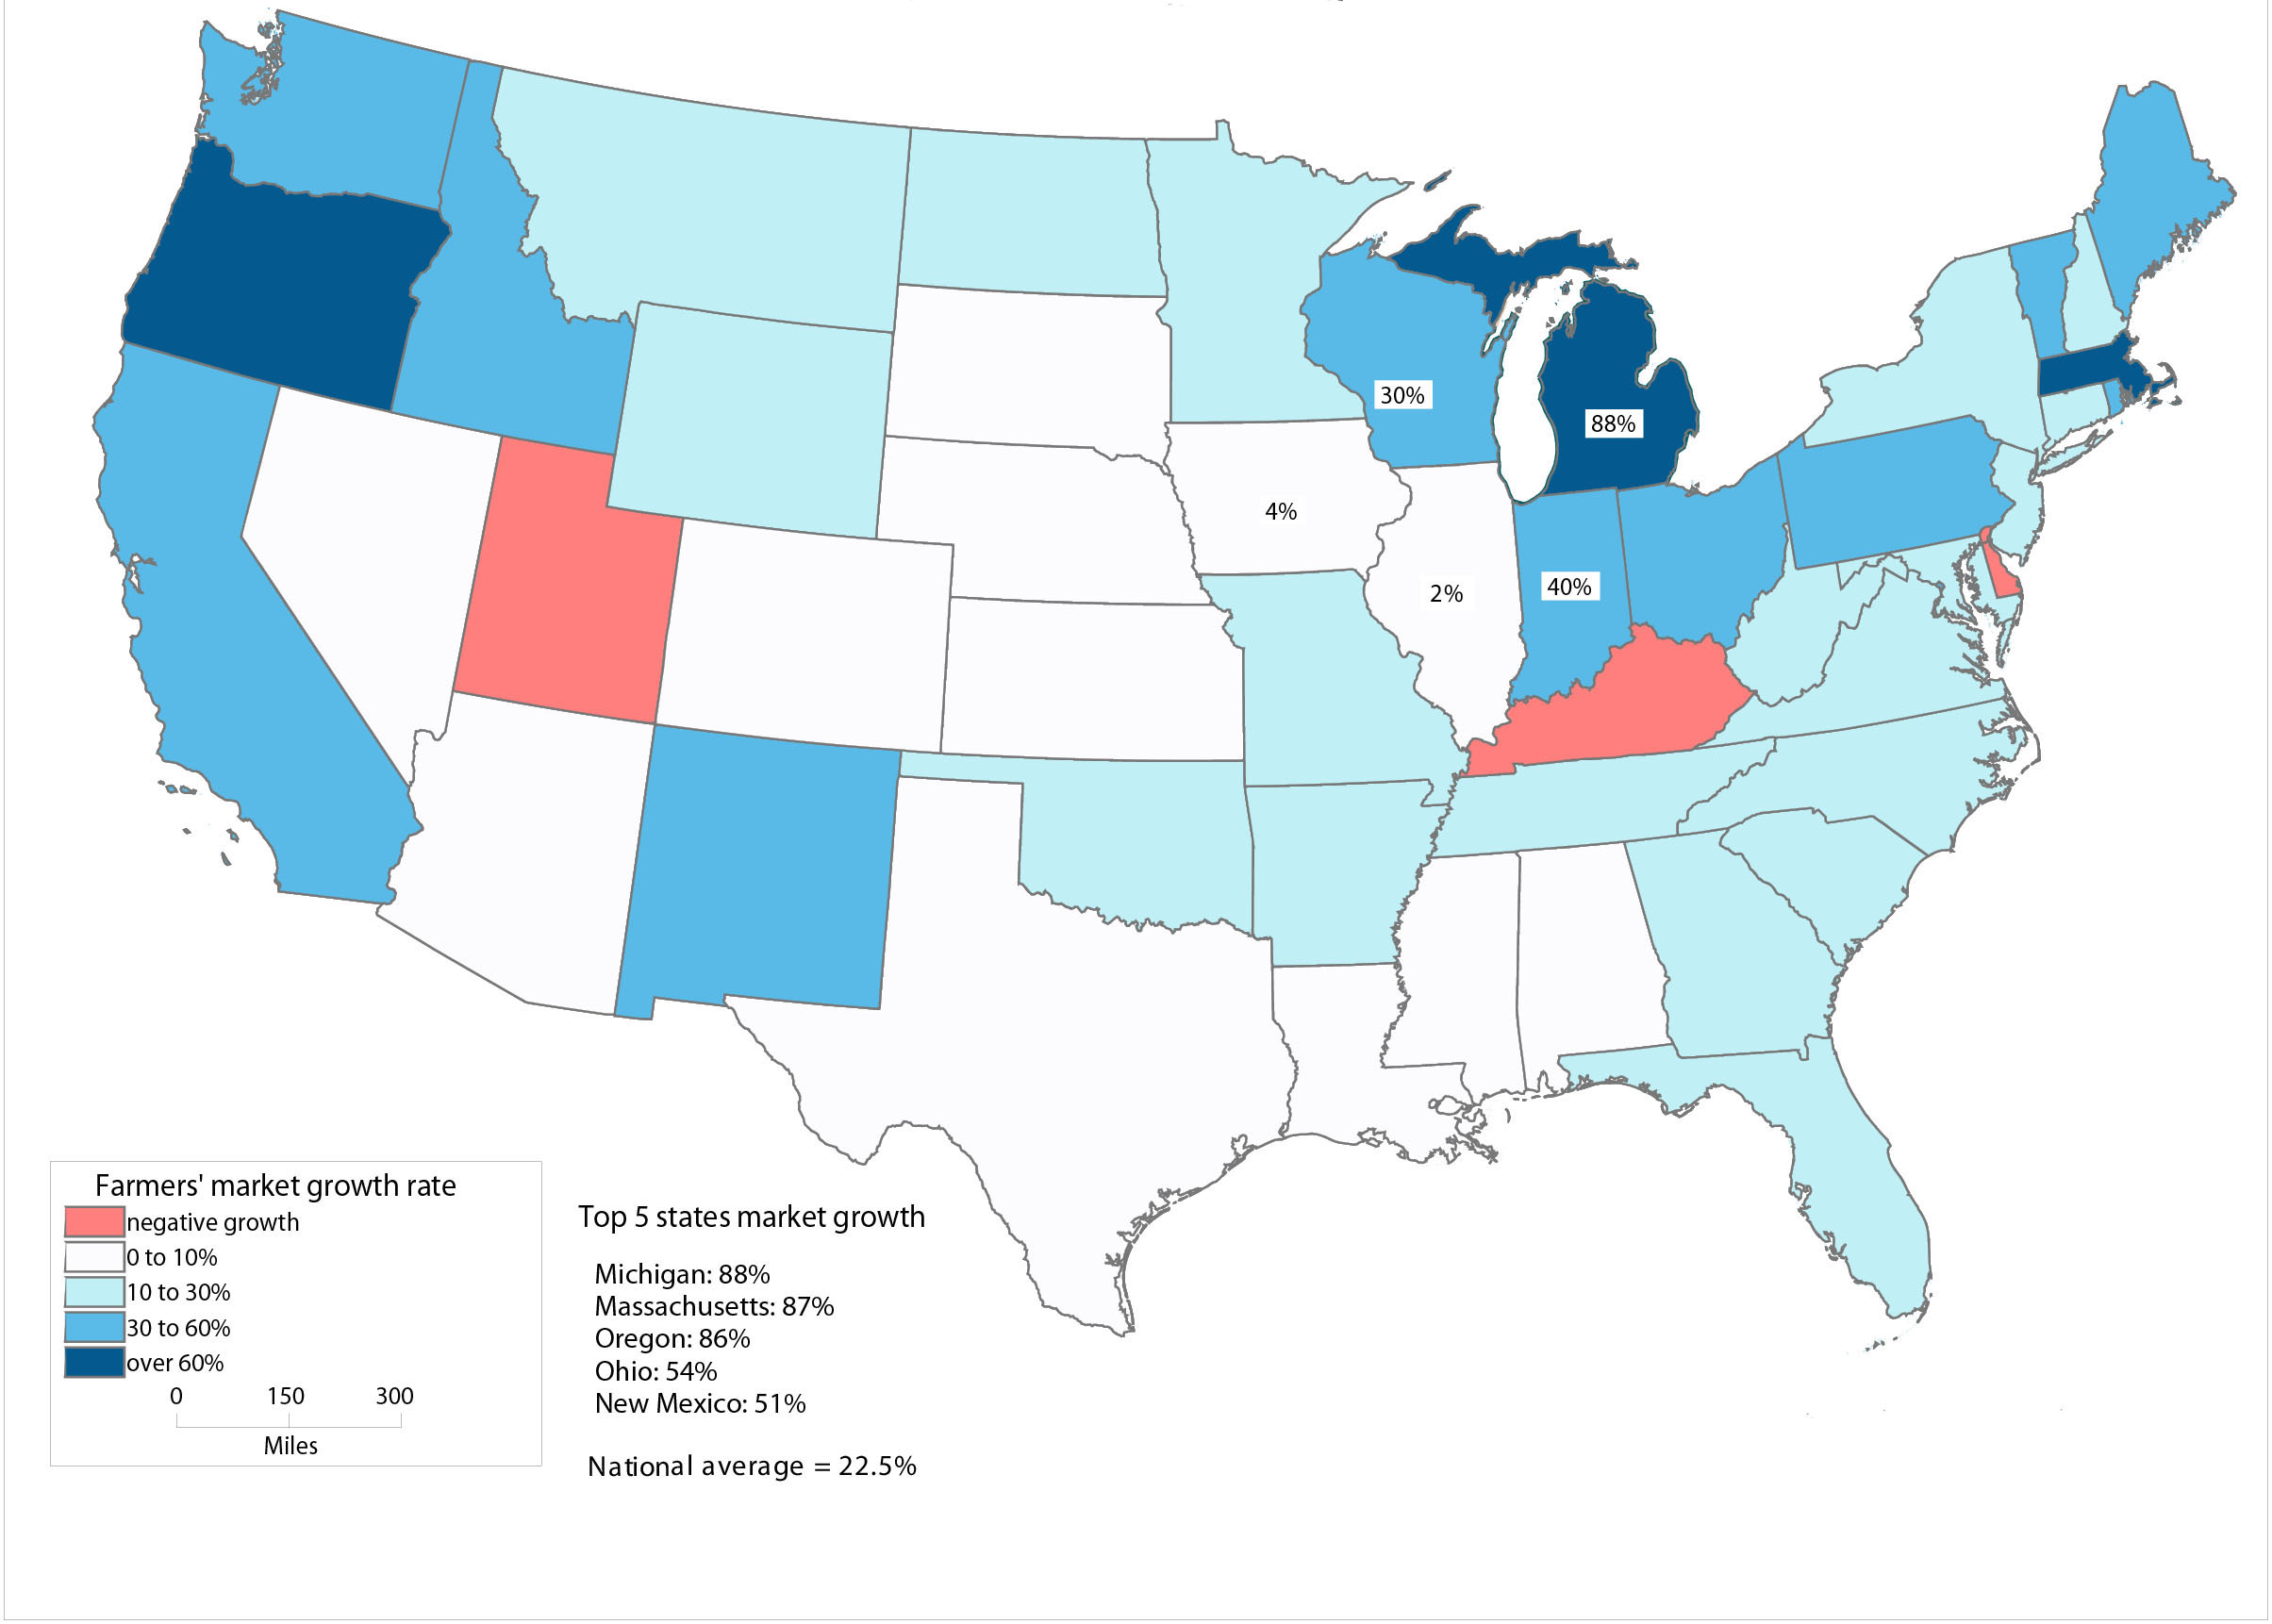
Since the AMS began documenting farmers’ market trends in 1994, the period between 2009 and 2011 witnessed the highest national two-year growth rate to date: farmers’ markets expanded by over 36%. During this time, Michigan experienced the highest growth of all states. The number of markets nearly doubled, from 163 markets in 2009 to 322 in 2011. The only other states with growth over 80% were Oregon and Massachusetts. Average growth across the nation was 22.5%. Like Michigan, Wisconsin and Indiana have seen many new farmers’ markets pop up in the past two years at growth rates of 30% and 40%, respectively, while Iowa and Illinois saw little change.10
2. National Map of Farmers’ market growth by state from 2009-2011 (average percent change in market count per state)
August 16, 2012
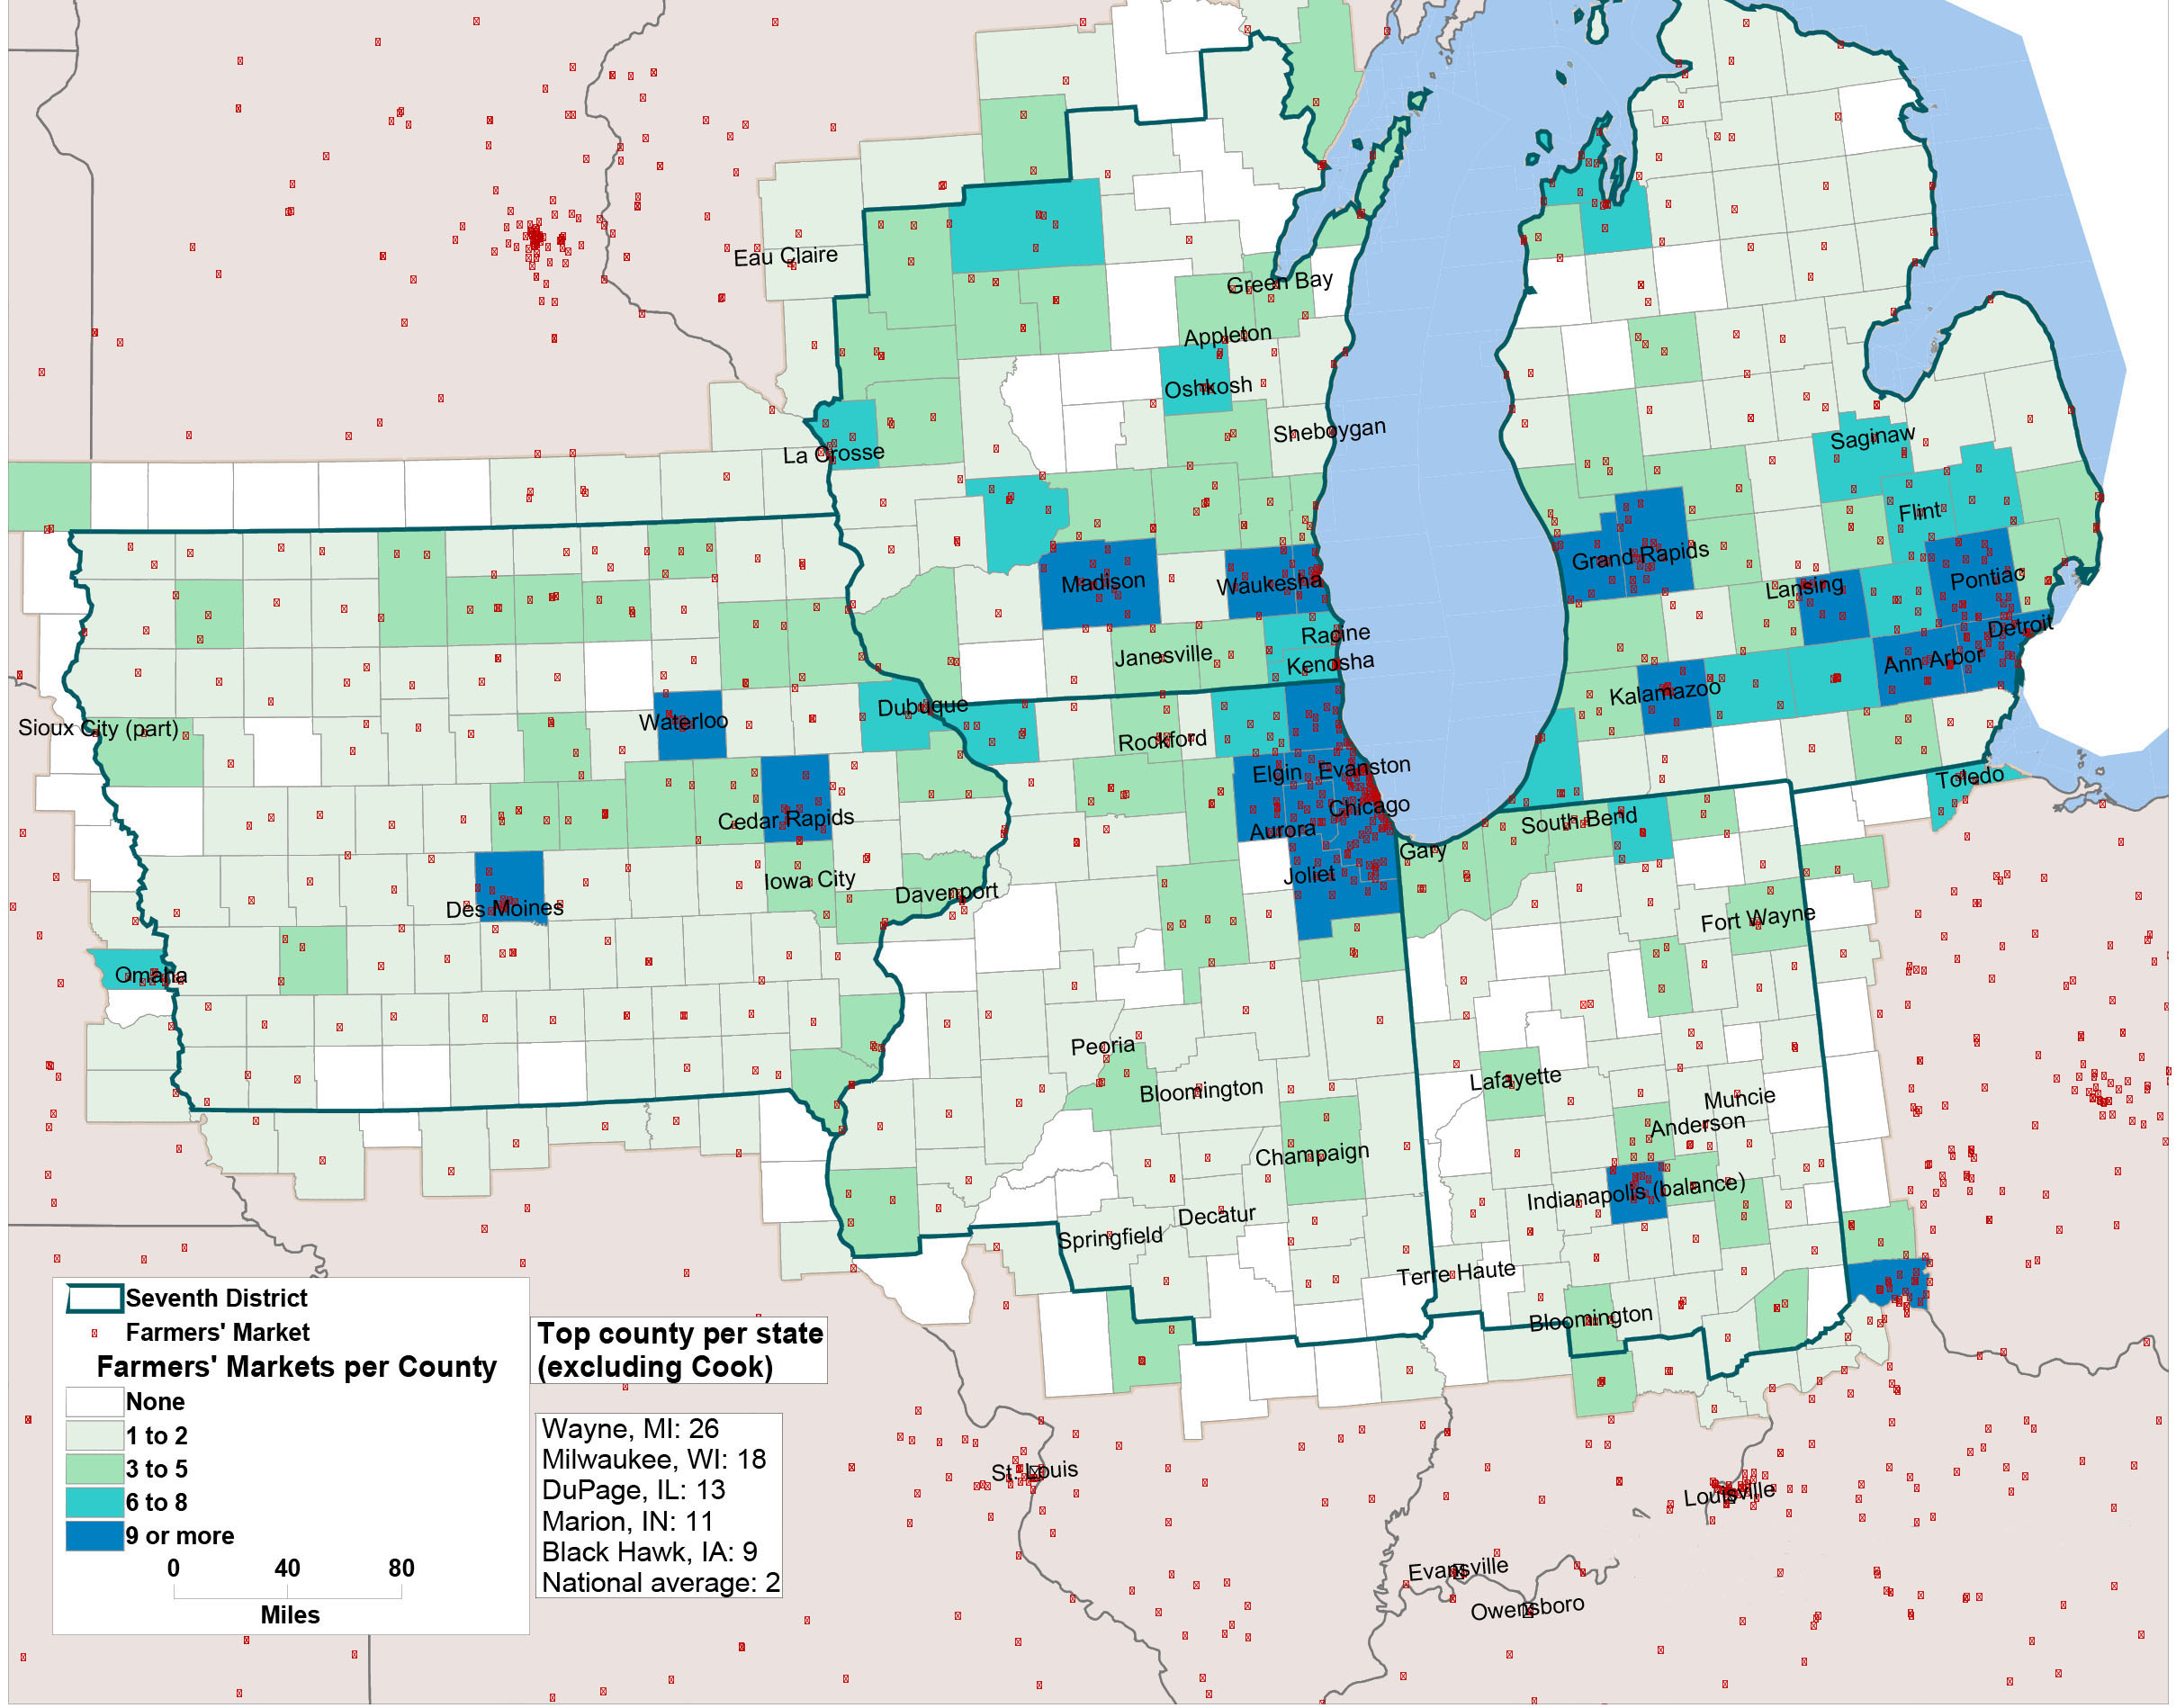
Within the Seventh District, farmers’ markets are most concentrated near major cities, such as Des Moines, Cedar Rapids, Madison, Chicago, Indianapolis, and Ann Arbor. Not surprisingly, Chicago’s home county, Cook County, with 93 markets, has the highest number of farmers’ markets of all Seventh District counties.
3. Seventh District Map of Farmers’ Market Locations and total markets per county as of July 2012
August 15, 2012
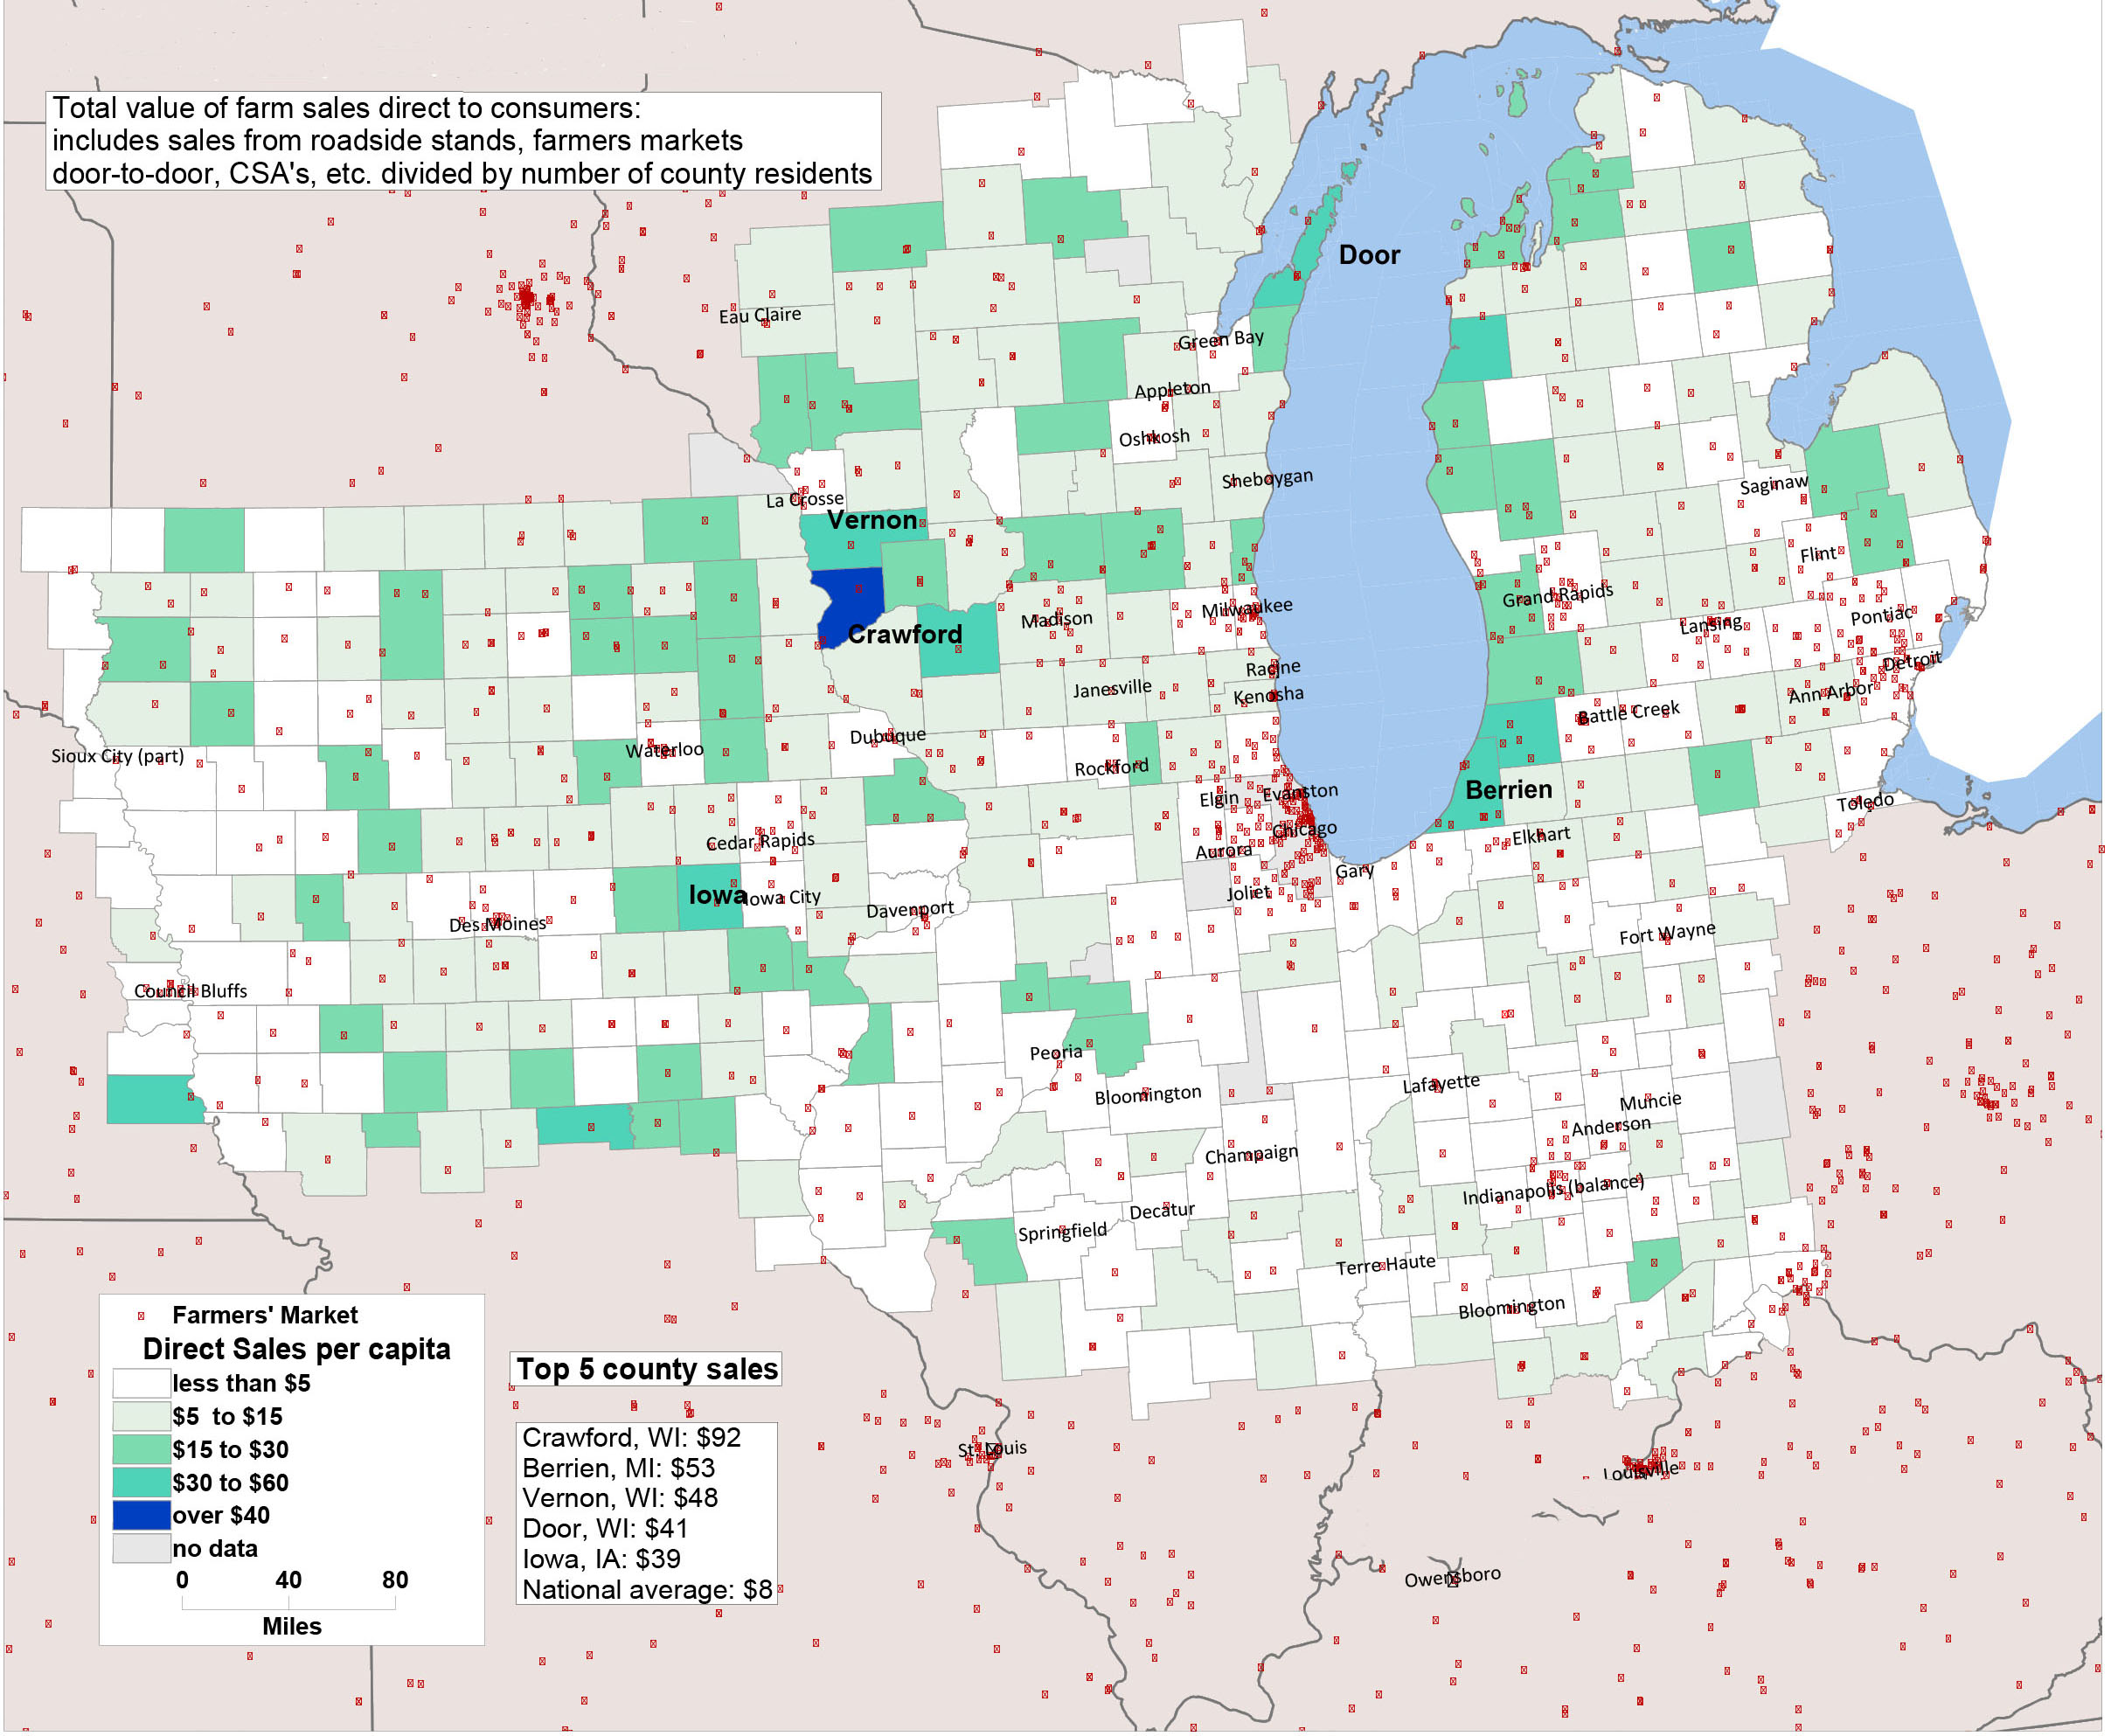
However, this pattern shifts when viewing direct farm sales per person. Crawford County in southwest Wisconsin, with two farmers’ markets and a population of approximately 17,000, claimed the highest direct farm sales per resident at $92 as of 2007.11 Wayne County, Michigan, with 26 farmers’ markets—the county with the second largest number of markets in the Seventh District—had substantially lower direct farm sales per capita at $0.90 per resident.12
It is not surprising that farmers’ markets concentrate in highly urbanized areas; aggregate demand is highest near major cities and farmers can reach a greater customer base by selling at urban markets.
However, individual demand for fresh fruits and vegetables appears more idiosyncratic. Counties containing major metropolitan areas, such as Des Moines, Indianapolis, Detroit, and Milwaukee, reported less than $5 per capita in annual direct farm sales as of 2007. Average shoppers tended to spend more outside of the larger cities. Crawford, Door, and Vernon counties in Wisconsin rank in the top five counties with highest per capita direct farm sales, and each has fewer than 30,000 inhabitants.
4. Seventh District Map of Direct Farm sales per capita by county
August 15, 2012
Why are per person sales so much higher in these more rural counties? If cities draw the most farmers to market, why aren’t urbanites also spending more than their suburban and rural counterparts? Agritourism may be part of the answer. Berrien County, Michigan, has the highest agritourism revenue in the Seventh District, grossing over $2 million in 2007, and also has the second highest direct farm sales per capita.13 Door County draws many visitors each year to its fruit orchards and wineries; Door County had the seventh highest agritourism revenue in the Seventh District, grossing over $680,000 in 2007. However, this does not explain Crawford County, where residents spend over $90 each per year at farmers’ markets, despite the fact that agritourism is negligible. The dynamics of farmers’ market patronage likely involve several crosscurrents, including residents’ incomes, community organization, awareness of environmental and health issues related to food, educational attainment, and proximate land quality.
5. Seventh District Map of agritourism sales by county
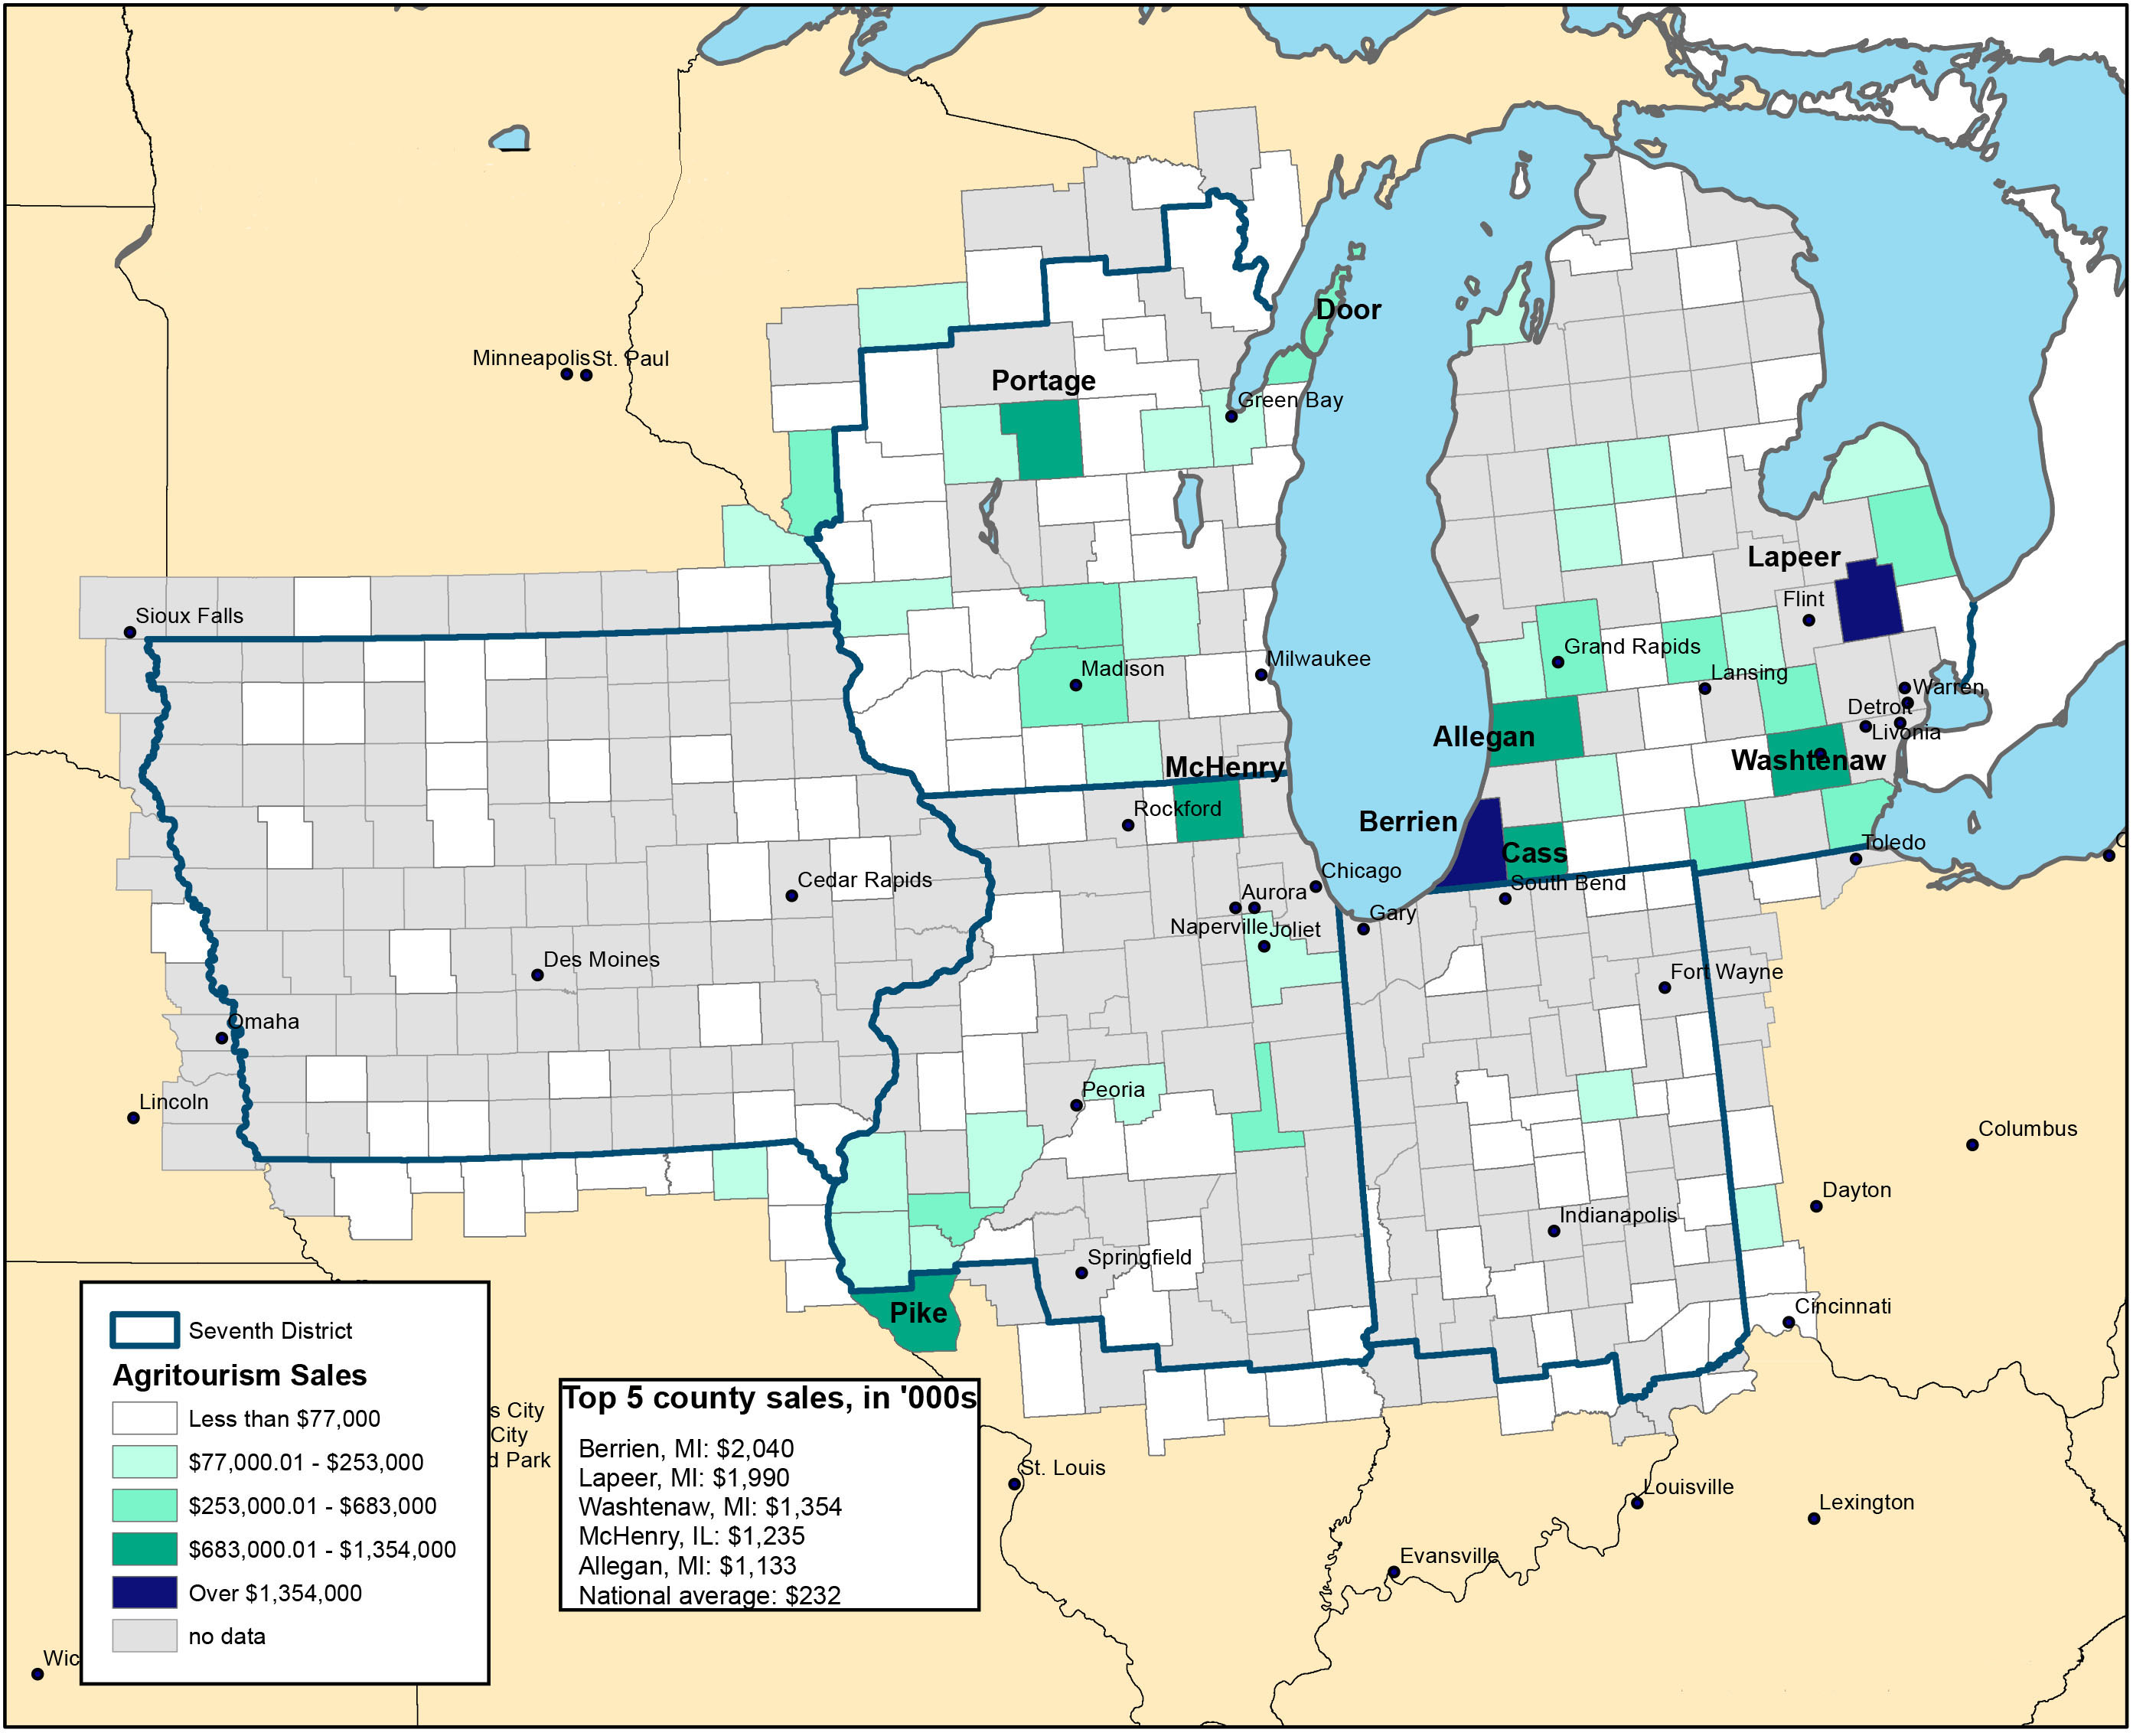
October 29, 2012
The nation’s heartland has been a leader in the ongoing evolution of fresh food marketing. Seventh District residents spent slightly more at farmers’ markets in 2007 than the average American—about $8.50 per person versus $8.00. Future opportunities for the District’s market goers are strong. Growth trends may widen the gap. Between 2009 and 2011, Seventh District counties added 38% more farmers’ markets on average, a rate twice as high as the national average of 18.4%. Considering national growth in farmers’ markets has remained above 10% for the past five years, we can expect to see more farmers stacking baskets of peaches and bunches of kale under tents in our town squares and parks, as well as more patrons enjoying the local bounty.
Footnotes
1 Rhiannon Jerch is a graduate student in the Department of Agricultural and Consumer Economics at the University of Illinois at Urbana-Champaign. Her research interests include consumer behavior, choice theory, spatial econometrics, and food policy. Rhiannon interned with the economic research department of the Federal Reserve Bank of Chicago in 2012. Previously, Rhiannon worked in transfer pricing with Ceteris US, LLC in Chicago and in transaction services with PricewaterhouseCoopers in Cairo, Egypt. Rhiannon received a bachelor’s degree in economics from the University of Illinois at Urbana-Champaign.
2 “Thanksgiving, The Civil War, and Cranberry Sauce.” Julia Sexton, Westchester Magazine. October 20, 2010.
3 “Early rotary egg beaters,” Home Thing Past.
4 USDA Agricultural Marketing Service. Farmers Markets Search.
5 USDA Agricultural Marketing Service. “Farmers Market Growth.”
6 Masiunas, John B. Class Lecture. Local Food Systems. University of Illinois at Urbana Champaign, Department of Crop Sciences, Urbana IL. Spring 2012.
8 Starbucks Corporation Fiscal 2011 Annual Report.
9 The Seventh Federal Reserve District comprises all of Iowa and most of Illinois, Indiana, Michigan, and Wisconsin.
10 USDA Agricultural Marketing Service. “Farmers Market Growth.”
11 Total value of farm sales direct to consumers (including sales from roadside stands, farmers markets, pick-your-own, door-to-door, etc., but not sales of craft items or processed products, such as jellies, sausages, and hams) divided by the number of residents of the county. USDA. Food Environment Atlas Documentation. July 2012.
12 Per capita direct sales were unavailable for Cook County.
13 USDA. Food Environment Atlas. July 2012.


