Trends in Motor Vehicle Trade—A U.S. Perspective
Motor vehicles tend to be sold near where they are produced. However, when local demand does not suffice to support a dedicated assembly plant, some vehicles are shipped across longer distances, including across oceans. The share of newly produced light vehicles (cars and minivans, sports utility vehicles or SUVs, and pickup trucks) exported from the U.S. to countries other than Canada or Mexico averaged only 4% of U.S. light vehicle production between 1996 and 2011. The share of new vehicles imported from outside the NAFTA (North American Free Trade Agreement) area was somewhat higher over this period, at 19%, as the U.S. has traditionally run a trade deficit in cars and light trucks.1
This blog updates our earlier analysis on U.S. vehicle exports and adds some discussion related to vehicle imports.
Exports
During the past two years, exports of new and used vehicles from the U.S. have continued the strong growth exhibited since 2003. After the sharp decline of activity during the latest recession, exports rose again sharply and, by the end of 2011, had nearly matched the pre-recession peak reached in 2007 for new vehicles and in 2008 for used ones (figure 1).
Figure 1. U.S. exports of light vehicles
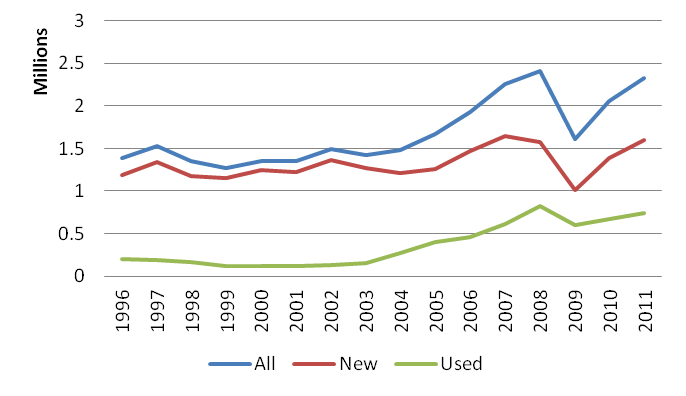
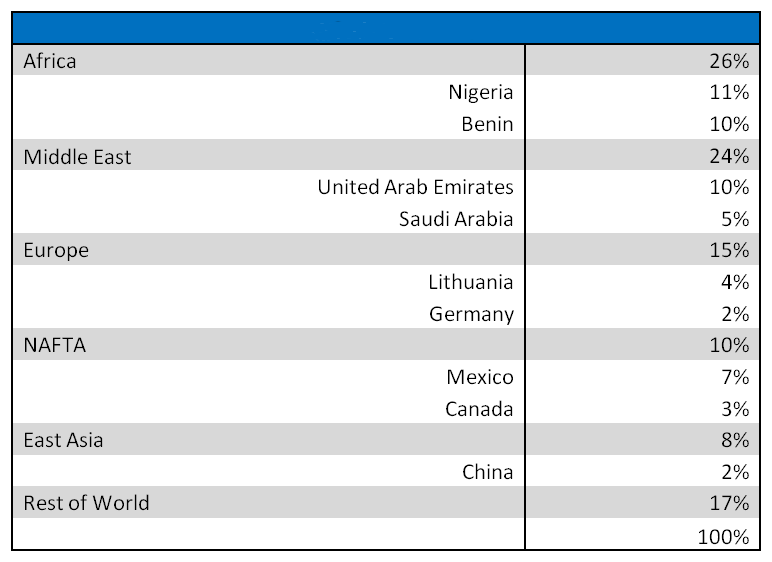
Table 1 provides more detail regarding destination countries and regions for exports of new and used light vehicles from the U.S. While Canada and Mexico together represent the primary destinations, the relative importance of these two NAFTA partners has fallen a bit since 2007 (representing 55% in 2011, down from 64% four years ago), as most of the growth in exports of U.S. produced new vehicles originated from elsewhere (figure 2). Last year, Germany and China were as important as Mexico as destination for U.S produced new vehicles. Exports of used vehicles, on the other hand, are much more dispersed; Nigeria, Benin, and the United Arab Emirates jointly account for nearly one-third of all U.S. used-vehicle exports.
One of the factors behind this trend is the implementation of new trade agreements, such as the U.S. free trade agreement with South Korea, which was ratified in November 2011 and reduces South Korea’s tariff on passenger vehicle imports from 8% to 4%. Both the Detroit-based carmakers (Ford, General Motors, and Chrysler) and Honda and Toyota have announced a noticeable increase in exports of vehicles produced in the U.S. to South Korea. In the case of the Japanese-based carmakers, the decision to export to South Korea from North America instead of from Japan is likely influenced by exchange rate trends, which have strengthened the yen for some time.
Another phenomenon that has coincided with the increase in the share of non-NAFTA destinations has been the arrival in the U.S. of premium producers, such as Mercedes and BMW, that now ship output from their U.S. locations to countries around the world. While the U.S. and more generally, North America, very likely represent the largest single market for vehicles produced at the U.S. plants of these two producers, they tend to export a much higher share of their the U.S.-based production than a typical mass producer of vehicles. Furthermore, their U.S.-based plants are the sole producers of specific products, suggesting that their role in motor vehicle exports from the U.S. is not being jeopardized by the current lower rates of capacity utilization in the European motor vehicle industry.
Figure 2. Exports of new vehicles: NAFTA vs. other destination countries (units)
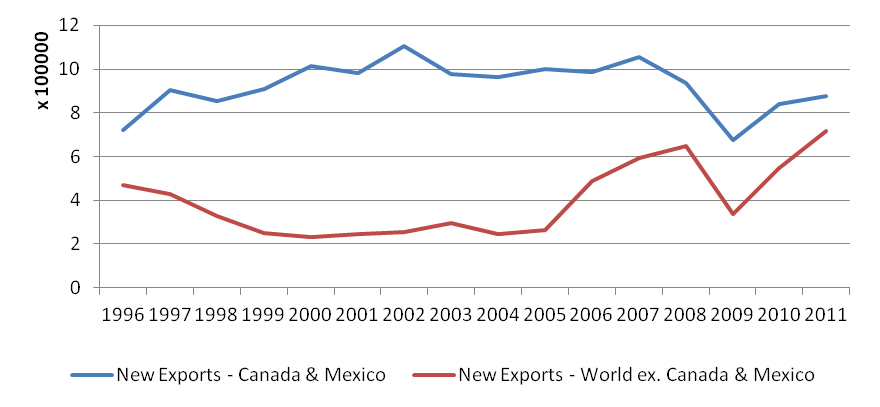
Table 1. New vehicles
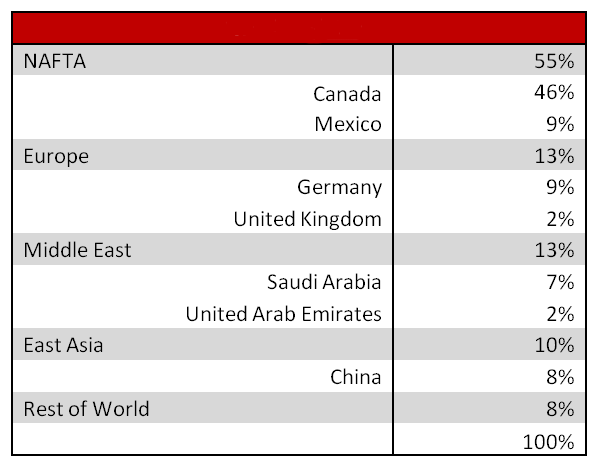
Table 2. Used vehicles
Imports
Data on imports of vehicles sold in the U.S. are available for a much longer time frame. Vehicle imports have averaged 20.6% of U.S. sales since 1980. That share declined rapidly during the decade between the mid-1980s and the mid-1990s—a time when foreign-based producers quickly expanded their production capacity within North America, ramping down their imports of finished vehicles from overseas in turn. This “onshoring” of vehicle production has a corresponding impact on the trade in motor vehicle parts. When an overseas producer’s vehicle assembly plant is first set up in the U.S., the so-called domestic content, that is, the share of parts sourced from within the U.S., is noticeably lower than that of a comparable native assembly plant. Over time, however, the domestic parts content of vehicles produced by foreign-headquartered producers tends to rise significantly.
Since the mid-1990s, the import share of U.S. sales has been trending up again as additional companies have entered the U.S. market. The small car segment, of heightened interest to consumers in times of rising gas prices, represents a relatively small share of the overall market in the U.S. and many of the small vehicles sold in the U.S. tend to be produced overseas. However, the import share of U.S. vehicle sales has declined by 4 percentage points during the past two years (figure 3) despite rising gas prices –gas prices were rising from the beginning of 2009 through May of 2011. Figure 3 also illustrates that cars continue to represent a large majority of imported vehicles.
Figure 3: import share in US light vehicle sales (blue line) and car share in US vehicle imports (red line)
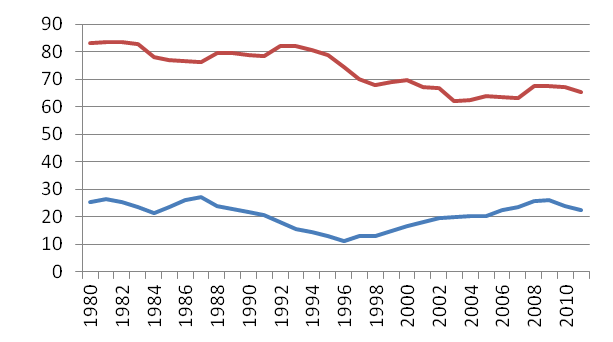
Source: Ward’s autoinfobank
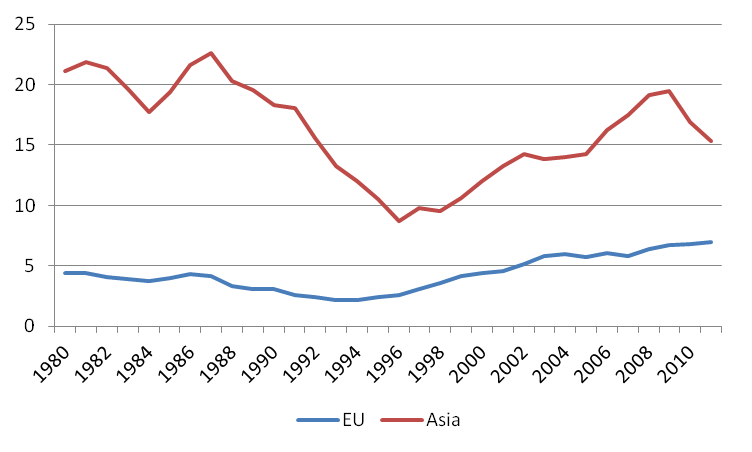
Figure 4 shows that the decline in the vehicle import share results from a decline in imports from Asia, as European imports have continued their steady increase exhibited over the last 15 years. Japan, by far the largest source country of U.S. vehicle imports from Asia, was negatively affected last year by the earthquake and subsequent tsunami. However, the decline in imports starts earlier than that, suggesting a contributing role of the yen/dollar exchange rate, which started a steady decline (strengthening of the yen) in 2007. In fact, while the share of U.S. light vehicle sales represented by imports from Asia peaked in 2009, the share of U.S. sales represented by vehicles produced in North America by Asian headquartered carmakers continued to rise through 2010, barely showing a decline in 2011. By the end of February 2012, that share had reached 30.4%, surpassing the previous peak from 2009 (29.9%). In other words, the share of U.S sales represented by North American production of foreign headquartered carmakers did not experience the same decline as that of vehicles imported from Asia.
Figure 4: Import share of US light vehicle sales by region of origin
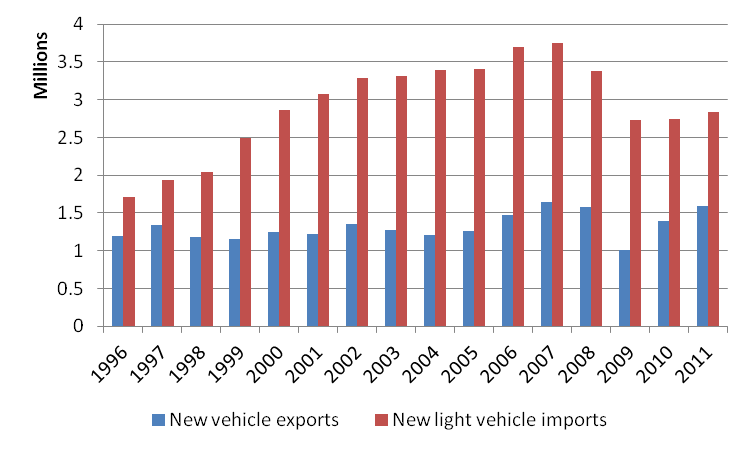
Combining both of these developments, rising exports of new vehicles, up 50% since 2009, and declining imports of light vehicles, nearly flat since declining by a million units between 2007 and 2009, have resulted in the smallest U.S. trade deficit in light vehicles since 1998 (see figure 5).
Figure 5: U.S. vehicle imports and exports
Footnotes
1 Data on imports, sales, and production, are from Ward’s Auto Group, Auto Infobank, online database; data on exports are from the United States International Trade Commission website. Note that the definitions in both data sets don’t match perfectly. Ward’s data are based on individual vehicle models and their size classes. The trade data on vehicle imports are defined, at the most disaggregated level, by fourteen 10-digit codes and distinguish passenger vehicles from vehicles for the transport of goods, engine type, and engine capacity.


