Will Efforts to Fix Illinois Budget Hamper Economic Growth?
A famous quote by a notable economist, Herbert Stein, is that “If something cannot go on forever, it will stop.”
An independent “State Budget Crisis Task Force” recently concluded unambiguously that “The existing trajectory of (Illinois) state spending and taxation cannot be sustained.” This follows a growing recognition by many observers and analysts that state government (and many local governments) in Illinois have been running chronic deficits, financing public services each year for many years through added debt. Although the state’s primary funds (the General Funds) were often reported to operate in balance, total state liabilities typically exceeded revenues collected.1
As a consequence, Illinois state government finds itself today with hefty unfunded debt obligations—namely unfunded pension liabilities and unpaid bills for current services—amounting to over $100 billion. These debt obligations represent payment claims for government services that have already been delivered.2 While the state government paid the wages and salaries of its teachers, professors, and state workers at the time that their services were provided, part of the employee compensation for these services was deferred to the future through the promise of retirement income. But, the state government did not put aside sufficient financial assets to pay the promised retirement income and other deferred benefits. Looking forward, no one expects the state’s likely economic growth path to lift tax revenue streams much above recent (tepid) norms.
And so, given anticipated expenditures for new and expanded programs, such as federally mandated health care expansion, expenditures for public services are likely to continue to outstrip available revenues. Agencies that rate the quality of debt for would-be investors have declared the state’s bonded debt to be of the lowest quality among all states. Thus, the state’s debt position can be expected to deteriorate further without significant intervention by the state government. Indeed, elected officials will need to act very soon to restore confidence.
To do so, the state is left with a only a couple options—cuts in spending (including cuts in promised pension payouts) and hikes in taxes and fees.3 Curbs on the growth of spending are clearly in the cards. Even if the state devotes increasing revenues to paying down its accumulated debt—which it is now doing—it will likely also require sharp declines in public service provision. Already, for example, state aid to public education has flattened out over the past three years. Similarly, the state has trimmed its promised pension benefits for new state employees.4
The other possible course of action is for the state to increase tax revenues, so as to chip away at (and eventually eliminate) the debt accumulated for past public services, while covering normal and expected revenue demands of the years ahead. If we compare the overall average tax burden of Illinois with that of its neighboring states over the past 15 years, we find that Illinois actually kept its tax burdens lower than its neighbors’ from FY 1995 through 2010 by deferring its commitments for employee compensation. However, now that debts must be repaid, tax burdens will possibly rise above national and regional norms. Accordingly, a potential downside is a dampening of growth and development as rising taxes, without any accompanying rise in services, diminishes the attractiveness of investment and livability in the state.
How High Are Illinois’s Taxes?
There are many ways to measure and compare tax burdens and many individual taxes that can be compared. But in the aggregate, tax burden can generally be thought of tax revenues collected from households and businesses as a share of the productive commercial activities of the state. Such an aggregate tax rate represents the share of a state’s annual production that is charged by government to pay for public services provided to households and to businesses.
In the following analyses, we construct such an aggregate or average “tax rate” (ATR) for a state in any given year.
State’s tax rate (ATR) = state & local tax collections/state output
Tax revenues are those collected by all state and local governments in a state, rather than by state government alone. The measurement of an aggregate tax rate must include both state and local governments because the split of revenues collected between state and local differs from state to state. In each state, public service responsibilities are assigned differently to state government versus the state’s local governments—school districts, municipal governments, county governments, and special districts such as libraries and park districts. For example, particular public safety responsibilities may be alternatively assigned to the state highway patrol, county sheriff’s department, or a city police force. Given such differences, an “apples to apples” comparison can only be made by combining all revenues within a state into one measure of “state and local government taxes collected.”5
In the denominator of our measure of ATR, a state’s annual productive output is effectively measured by annual dollars of gross state product (GSP, the local counterpart of GDP), which represents total annual output from all industry sectors located within state boundaries. So, the tax rate (ATR) is the share of productive output (GSP) that is claimed by state and local government to pay for public services.
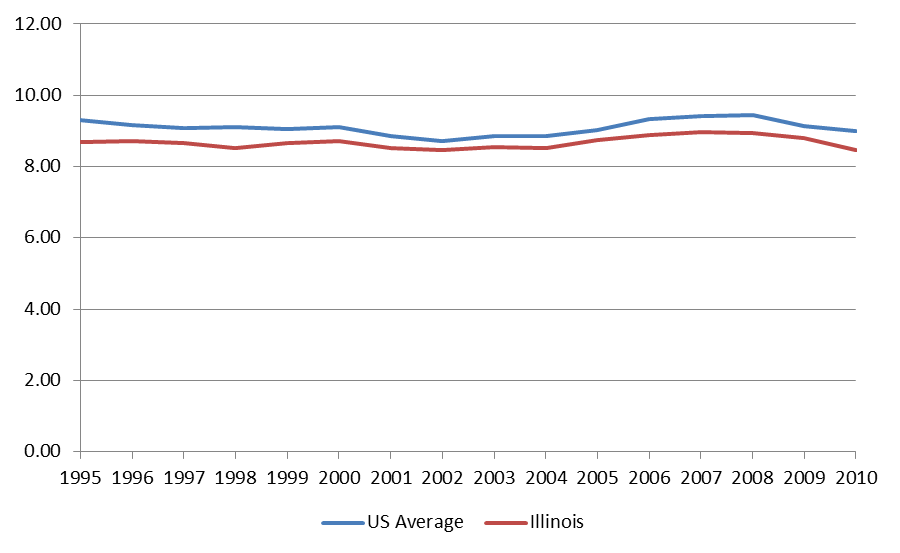
Looking at the Illinois aggregate tax rate from 1995 through 2010, we find that Illinois consistently maintained a lower tax rate that the national average (see chart).6
Chart 1. State and local taxes as a percent of GDP FY1995-FY2010
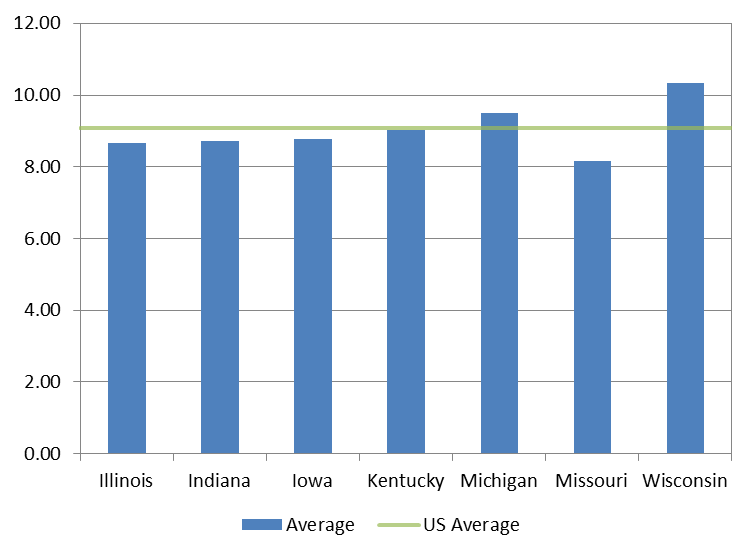
In the next chart, we compare Illinois’s ATR to both the U.S. average (green line) and its neighboring states’ ATRs during the same period (blue bars). As well as being lower than the national average, the Illinois tax burden was also lower than those of its neighboring states, with the exception of Missouri and Indiana.
Chart 2. Tax revenues as a percentage of GDP FY1995-FY2010
It is generally thought that Illinois was able to maintain a low tax rate because it paid for current services through borrowing rather than through concurrent taxation. As documented by the Fiscal Futures Project, the state’s main borrowing vehicle was to underfund its mounting obligations for employee retirement. In particular, state government in Illinois maintains primary responsibility not only for its own employees’ retirement benefits, but also for those of the bulk of the statewide university system and the local school systems.7 As of FY 2012, the unfunded pension obligations were estimated at $95 billion for the state’s five pension systems, which amounts to approximately $8,000 per capita. One estimated comparison among states for 2010 reported Illinois to have the lowest funded proportion of pension obligations, with only 45% of reserves available to meet promised payouts.
How Will Paying Off the Debt Affect Illinois’s Competitive Tax Position
Would raising taxes to meet Illinois’s public service needs (and pay off its debt) dampen economic growth? To answer this question, we look at estimates of expected gaps between Illinois’s revenues and ordinary spending. We recognize that Illinois will need not only to pay off pension-related debt, but also to meet other revenue demands for public services and other past-due bills. The state has been running in deficit, and will continue to do so to some degree, irrespective of the pension problem.
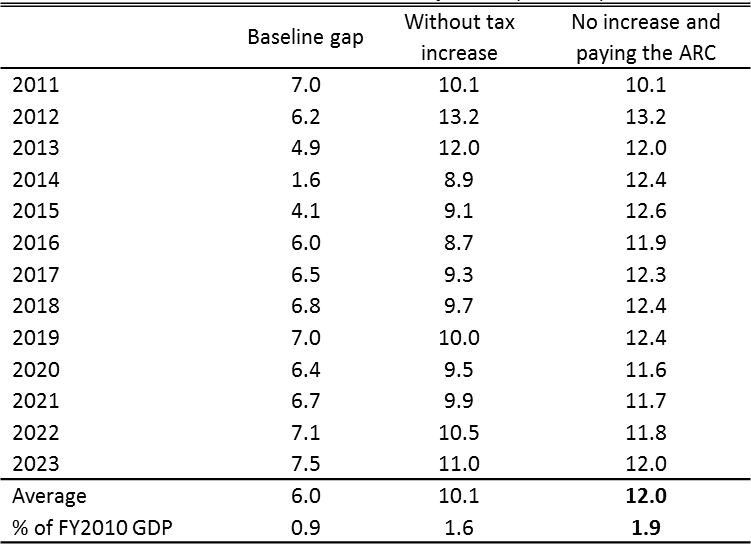
These estimates of future spending streams (and possible revenue needs) are from the Fiscal Futures Project (FFP). The FFP has consolidated the many State of Illinois Funds from which expenditures are financed. In addition, the FFP has examined past trends to predict future spending, and it has also incorporated expected new revenue demands related to, e.g., the Affordable Health Care Act. In our analysis, we take their projected average gap between spending demands and expected revenues for the years between 2011 and 2023. In particular, the gap reported in the final column in the table illustrates the hypothetical case in which Illinois cures its accumulated deficit through revenues alone. Under this scenario, the state incurs its ongoing service expenses as expected and pays down its accumulated unfunded pension liabilities on a 30-year schedule. If so, and without any new revenue enhancements, the state would run at a $12 billion per year annual deficit of expenses over revenue. This estimate is arrived at by assuming that Illinois’s recent hike in its personal income tax is allowed to expire, as it does under the current statute. The average gap is estimated to amount to 1.9 percent of GDP as measured for FY 2010.
Table 1. Illinois fiscal futures model projections ($billions)
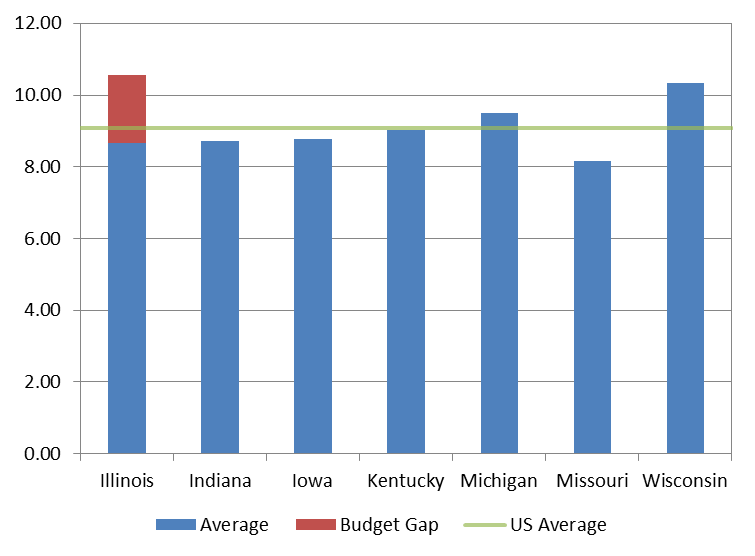
To illustrate the effect on Illinois’s ATR of this further 1.9 percentage point claim on the state’s economy, we add this to the ATR that was actually in effect (on average) from FY 1995 through FY 2010. As seen by the red addition to the tax rate for Illinois in the following chart, the payment gap could potentially hike Illinois’s ATR by 22% percent and leave the state with a higher tax rate than its neighboring states and the nation.
Chart 3. Tax revenues as a percentage of GDP FY1995-FY2010
Conclusion
It is clear from this exercise that, had public services been funded on a “pay as you go” manner, the state’s average tax rate would have been significantly higher than those of its neighbors and the nation for decades. Since public services would not have changed by using this method of payment, but taxes would have been higher, Illinois’s economic growth would likely have been lower. Going forward, at least part of Illinois’s accumulated debt will be paid for through revenue enhancements, which will push the state’s ATR above its long-run average, likely raising it relative to those of neighboring states
How much will this impede Illinois’s economic growth? Public taxes and services are not typically the most decisive factor in state growth and development. Indeed, many studies that have estimated the responsiveness of local growth to state-local tax differences find, on average, only a small to modest responsiveness of growth to state-local tax burdens. However, a tax rate hike of this size, which is conservatively estimated, would likely exercise a moderating overall influence on growth and development.8 And for some types of business activity, especially those that could easily escape the burden of taxation by moving across a nearby border, the impacts may be greater.
Footnotes
1 Per the State Comptroller, “there are over 602 active funds, four funds comprise what is commonly referred to as the General Funds. These four include the General Revenue Fund, the General Revenue – Common School Special Account Fund, the Education Assistance Fund, and the Common School Fund.” By one estimate, these General Funds comprise approximately 41 percent of the state’s consolidated funds.
2 The Illinois Commission on Government Forecasting and Accountability reports unfunded obligations for state pension funds of $94.6 billion for fiscal year (FY) 2012. Unpaid bills are estimated to be at $7.8 billion at the end of FY 2013, possibly growing to $21.7 billion by FY 2018.
3 The third option is to default on debt, including failing to fully meet pension obligations. This might also reduce the state’s ability to borrow.
4 As of January 1, 2011, newly hired employees covered by state plans have had their age for full retirement benefit raised, cost of living adjustment trimmed, and maximum pension amounts capped, among other changes.
5 The federal government also imposes taxes and sends grants-in-aid to state and local governments. These differ from state to state, and they are excluded here. States also share tax collections with their local governments (to varying degrees), which is another reason to combine state plus local tax collections in each state for comparison purposes.
6 Governments also collect user fees, such as tuition and highway tolls, to pay for services. Calculations to include them are completed separately, and do not change our results.
7 An exception, the City of Chicago School System funds and maintains its own retirement program.
8 These estimates of likely hikes in the ATR are conservative, given the high levels of debt that are excluded from the calculations. State government also carries very high levels of unfunded retiree health care liabilities, amounting to approximately $40 billion dollars. Unfunded pension liabilities for governments overlying the city of Chicago amount to another $23 billion, while no comprehensive estimates are available for the many underfunded local municipal pensions throughout the rest of the state. Moreover, ordinary “bonded” state and local government debt levels across Illinois rank among the highest in the country—8th among 50 states in per capita terms.


