Seventh District R&D: Manufacturing the Leader
Few would take issue that the U.S. economy is propelled by innovation. To stay ahead of their competitors, virtually all enterprises engage in innovation of one form or another. Such innovations take the form of improvements to products, services, and internal processes of production and delivery. In the case of start-ups or new enterprises, the proportion of activity devoted to innovation can be the dominant activity for years prior to its actual operation and revenue generation. Start-up firms have captured the imagination of cities that are encouraging entrepreneurs in their pursuits.1 Recently, the State of Illinois has offered funds to expand Chicago’s prominent new business incubator, which is named “1871” in reference to re-building from the great fire of that year. Similarly, the City of Detroit will seek to designate and boost its “TechTown” as a major part of its economic redevelopment.>
Many established businesses also engage in innovation, but they do so in a more formal way, that is by budgeting for and performing research and development (R&D). The National Science Foundation tracks R&D funds across all sectors, including the U.S. business sector. Their preliminary estimates for 2012 report that the business sector overall performed 70 percent of the nation’s R&D, amounting to $316.7 billion, followed by federal government (12.2 percent), and universities and colleges (13.9 percent).2
In tracking R&D performance as measured in dollars that can be allocated across states, the table below ranks Seventh District states by the dollar amount of R&D for each of four major categories for the latest year available, 2011.3 The business sector dwarfs others in 2011, accounting for almost 70 percent of R&D performed. By this measure, each District state is ranked above the national average, with Michigan’s sixth place and Illinois’ eighth place figuring very prominently. Based largely on the strength of their performance in the business sector, these states also rank highly in overall R&D performed, at seventh for Michigan and eighth for Illinois. Significant contributions to their rankings are also evident from universities and colleges and federally funded R&D Centers (Illinois), and in the case of Michigan, universities and federal government operations.
Table 1. R&D performer in 2011
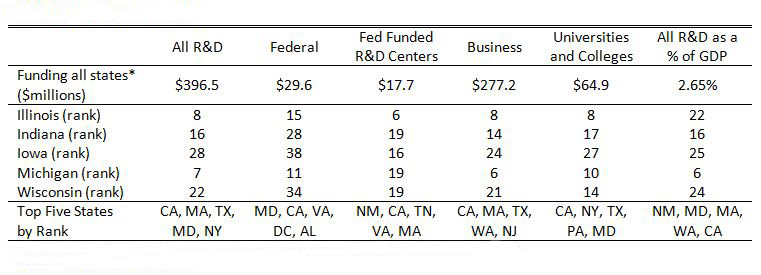
Source: National Science Foundation
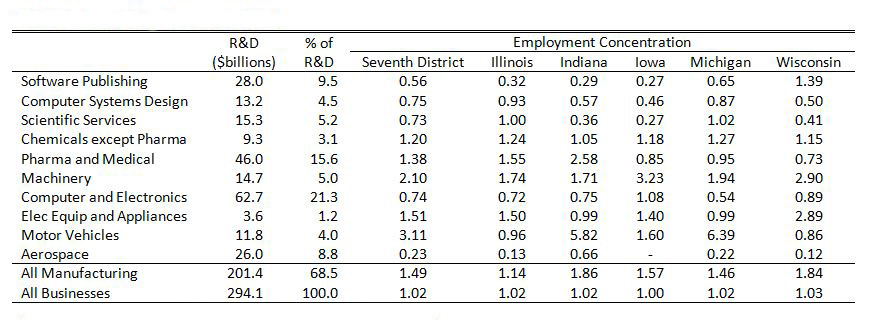
Within the business sector, manufacturing companies continue to conduct the lion’s share of R&D. As shown below, manufacturing performed 68.5 percent of private sector R&D in 2011. This is down from previous decades, as several service sectors have grown rapidly. In particular, the software publication, computer systems design, and scientific services sectors now comprise, in aggregate, 19.2 percent of R&D performed.
But rather than these service sectors, manufacturing remains the primary contributor to the Seventh District’s R&D prominence. The far right columns in the table below display the District’s relative employment concentration in leading R&D sectors by individual industry.4 The first three rows present the employment concentration of leading service industries in R&D performance. With a few exceptions, such as Wisconsin’s high concentration in software publishing at 39 percent above the national average, District state concentrations tend to fall below national levels. In contrast, the manufacturing leaders in R&D activity are much more concentrated in District states. For example, concentrations in non-medicinal chemicals such as industrial chemicals exceed national levels in every District state, as does the machinery industry concentration. Pharmaceuticals and medicinals are strong in Indiana and Illinois, while electronic equipment employment is especially concentrated in Illnois and Wisconsin. Meanwhile, employment concentrations in the motor vehicle industries are off the charts in Indiana and Michigan. And as previously discussed, automotive employment and spending for R&D have become much more concentrated there than the total employment numbers might suggest, as the state has held onto its R&D even as production activities have moved to other states and regions.
Among major R&D performers in manufacturing, the only area in which the Seventh District does not have a significant employment concentration is the computer and electronic products sector. This sector’s products and components are distinguished by “the design and use of integrated circuits and the application of highly specialized miniaturization technologies (which) are common elements….”5 Manufacturing activity and employment in this sector have tended to concentrate in California, Texas, Massachusetts, and other states outside of the Midwest region.
R&D performed by business in 2011
As regions look to innovation as the wellspring of their economic development, they may be well advised to build on their existing sources of innovation activity. For the states of the Seventh District, the traditional base of manufacturing industries is clearly an important candidate.
Footnotes
1 More information is available online.
2 Funding patterns differ from R&D performer patterns; the federal government funds almost 30% of overall R&D, with large proportions allocated to the business sector (especially defense contractors) and colleges and universities. The character of R&D also differs across sectors, with colleges and universities typically engaging in “basic” research, an activity that advances science with no specific application. In contrast, businesses more often fund development and applied R&D, activities that are intended to introduce new products or services into commercial use. See InfoBrief, NSF 140307, December 2013.
3 Individual state profiles with many measures are available online.
4 Employment concentrations are measured here across all occupations of firms in the sector, not solely R&D activities.
Note: Thanks to Timothy J. Larach for assistance.


