Early Fall Review—Economic Conditions Continued to Be Good in the Seventh District
Summary
We now have data for the Seventh District economy for the early fall, and they largely indicate that the nice run of good growth in the District continued. As has been the case throughout the year, the manufacturing sector was the driving force behind the good conditions—solid global growth and a revival in the U.S. energy sector continued to support important industries, such as steel, fabricated metals, and heavy machinery. In addition, national auto sales were quite good in September and October after a difficult summer. Outside of manufacturing, most sectors continued to experience slow but steady growth.
Now let’s look at the economic indicators that support this analysis.
The September Midwest Economy Index (MEI), which summarizes over 100 state and regional economic indicators for the District, continued to decline from its April 2017 peak (figure 1). The index indicates that growth was slightly below trend in September, though I argue in an addendum to this post that the September reading will be revised upward and the April reading will be revised downward.
Figure 1. Midwest Economy Index

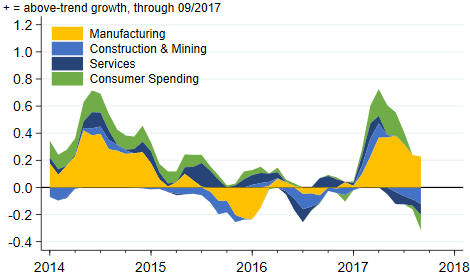
If we look at the subsectors that make up the MEI, we can see that the manufacturing sector declined some coming into the fall, but still expanded at a pace that was well above trend (figure 2). The other three sectors also declined; and by September, they had made negative contributions to the index. The consumer spending sector experienced the largest decline from earlier this year, with a +0.22 reading in May and a –0.11 reading in September. Again, some of this decline may be revised away.
Figure 2. MEI sectoral contributions
Widespread growth throughout the world and rising output in the oil and gas industry continued to support District manufacturers. The October reading of the J.P. Morgan Global Manufacturing & Services PMI (purchasing managers’ index) indicated global growth remained solidly in expansion territory (figure 3). Meanwhile, U.S. oil and gas production continued to trend upward in spite of processing disruptions in the Houston area caused by Hurricane Harvey (figure 4).
Figure 3. J.P. Morgan global manufacturing & services PMI
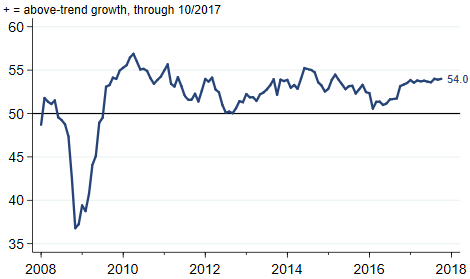
Figure 4. Industrial production index for oil and gas extraction

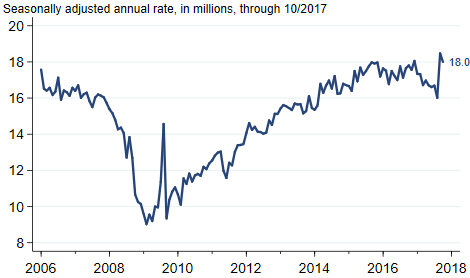
After a difficult summer, the auto industry had two very good sales months to start the fall (figure 5). A portion of the sales spike is surely illusory because of a temporary demand increase related Hurricanes Harvey and Irma, though there was likely some pickup in nationwide demand as well.
Figure 5. Light vehicle sales
Looking ahead, we should expect the District economy to continue on its current path if the global economy stays strong and the recent pickup in auto sales reflects good nationwide demand.
Addendum
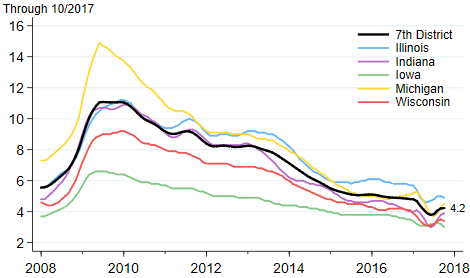
Why did the MEI’s consumer spending sector decline so much from May to September? One possibility is that the unemployment rate data (which are important consumer spending variables) are inaccurate and will be subsequently revised. Figure 6 shows that unemployment rates in every District state except Iowa dipped very low in early 2017 and have since climbed up some (the rates are all still quite low). In the past, the U.S. Bureau of Labor Statistics (BLS) has revised the unemployment data so that such dips are smoothed away. Thus, while it is likely that the unemployment rate has fallen in the District during 2017, it probably has fallen on a more linear trajectory. If the 2017 unemployment data are revised as I expect, the May MEI reading will be revised down (reflecting smaller decreases in the District states’ unemployment rates in that month) and the reading for September will be revised up (reflecting smaller increases or even no increases in states’ unemployment rates in that month).
Figure 6. Unemployment rates for Seventh District states