Late Summer Review—Seventh District Economy Still in Decent Shape
Summary
Growth in the Seventh District was pretty good to start the second half of the year, even though the pace was clearly slower than that of the first half. As is usual for the District, the manufacturing sector was the driving force behind this development. As I noted in the mid-year review, the boost in manufacturing activity appears to have been driven by growth in the global economy and the energy sector. Outside of manufacturing, most sectors continued to experience slow but steady growth. While the outlook for global growth and the energy sector generally looks good, concerns continue to mount for the auto industry.
Now let’s look at the economic indicators that support this analysis.
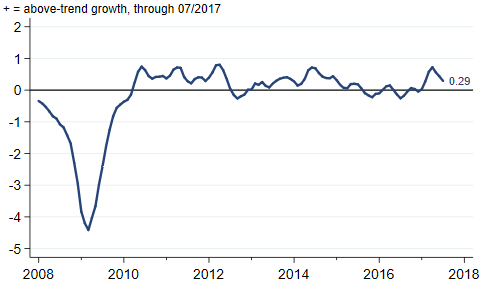
The July Midwest Economy Index (MEI), which summarizes over 100 state and regional economic indicators for the District, continued to decline from its April 2017 peak. That said, the reading remained positive, indicating that growth in the District was still above trend (figure 1).
Figure 1. Midwest Economy Index
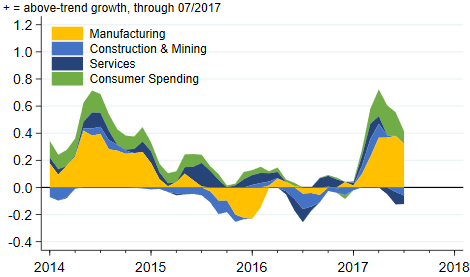
If we look at the individual sectors that make up the MEI, we can see that the manufacturing sector held steady and continued to make a strong positive contribution even as all of the other sectors declined some (figure 2).
Figure 2. MEI sectoral contributions
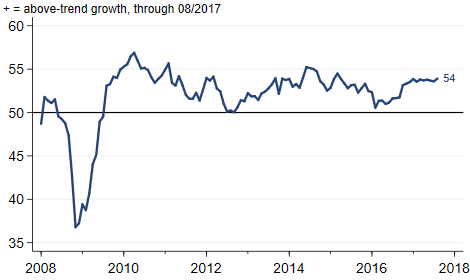
As I mentioned in my last review, District manufacturers appear to be benefiting from a pickup in global economic activity, and we have little reason to think this has changed in the past month and a half. According to the most recent reading of the J.P. Morgan Global Manufacturing & Services PMI (purchasing managers’ index), the pace of global growth remains well above its 2016 average (figure 3).
Figure 3. J.P. Morgan global manufacturing & services PMI
I also mentioned in my last review that District manufacturers appear to be benefiting from the pickup in energy activity in the United States. While little energy activity actually occurs in our District, a number of important manufacturing sectors for the District supply the energy sector (for example, steel, fabricated metals, and heavy machinery). Some recent data suggest growth in energy activity may be slowing some. Figure 4 shows that the U.S. rig count peaked at the end of July and has been relatively steady since (Hurricane Harvey appears to have temporarily affected refining capacity, but not extraction capacity).
Figure 4. Baker Hughes rig count

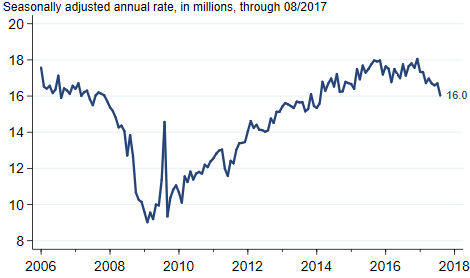
Evidence of a slowdown in the auto industry continues to build. Light vehicle sales dropped to a seasonally adjusted annual rate of 16.0 million units in August (figure 5). While some of that drop is likely due to Hurricane Harvey, the number is well below the year-to-date average of 16.9 million. The slowdown is starting to have an effect on auto industry employment, which has pulled back some since the start of the year.
Figure 5. Light vehicle sales
In spite of the difficulties in the auto industry, the District’s labor market continues to do well. For the sake of brevity, I’ll highlight just the unemployment rate, which, in spite of an uptick in August remains below the national level (figure 6). It has been quite rare in the past decade for the District’s rate to be below the national rate, and it’s hard to know what to make of this development. While it’s possible that some of the difference is measurement error, there is no question that the District’s labor market is tighter than it’s been in a long time.
Figure 6. Unemployment rates
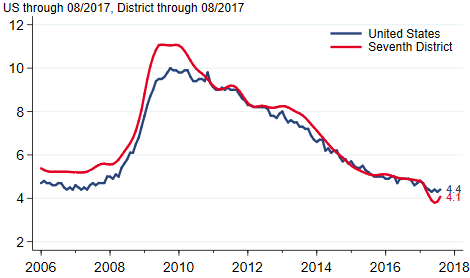
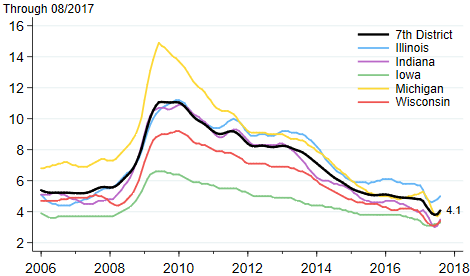
Figure 7 shows that the recent drop and subsequent uptick in the District’s unemployment rate is the result of such a movement in most District states, with the exception of Iowa (whose rate was already quite low). Michigan experienced a particularly sharp drop in its unemployment rate, so that Illinois is now the only state in the District with a rate that is higher than the national average.
Fiugre 7. Unemployment rates for Seventh District states
Looking ahead, the District economy faces a few important questions: Will the faster pace of global growth continue? Will the auto industry continue to slow? And if the current trends continue, which trend will dominate?


