

The United States is a diverse country, whether you’re looking at its economic, population, or environmental (i.e., topographic and weather) characteristics. Some places are growing quickly; others, slowly. Some are home to large numbers of computer programmers; others, just a few ranchers. Some are hot and dry; others, cold and wet. The U.S. is also a large country, with regions that themselves are the size of some countries. While these regions all share in major U.S. trends like recessions and an aging population, some regions track national trends more closely than others.
In considering the diversity of the U.S. across its regions, it is natural to wonder (at least for some), what region looks most like the nation as a whole? In this article, I offer an answer to this question by comparing the four major U.S. regions (as defined by the U.S. Census Bureau)—the Northeast, Midwest, South, and West—across a wide range of economic, population, and environmental characteristics. For the characteristics I examine, I find that overall, the South is most representative of the nation as a whole, followed by the Midwest and then the Northeast and West.
The South looks most like the U.S. in terms of economic characteristics
I first consider the economic similarities and differences between the nation and its four regions. For this comparison, I start with a set of key growth indicators: growth in real gross domestic product (GDP), employment, income per capita, and home prices. In the short run, there is typically little difference in these indicators across regions, but over the long run, the differences are easy to see, so I compare annualized 20-year growth rates (from 2003 to 2023). Figure 1 displays comparisons for the four growth measures, and there are three main takeaways. First, growth rate rankings are consistent across the four measures. Regardless of the measure, the West is fastest, followed by the South, the Northeast, and finally the Midwest. Second, while the rankings are the same for every measure, the dispersion of growth rates is different. Growth in income per capita is quite similar in every region, while growth in home prices is quite different. Third, across the four measures, the South appears to be closest to the U.S. average.
1. The South is most like the U.S. in terms of economic growth characteristics
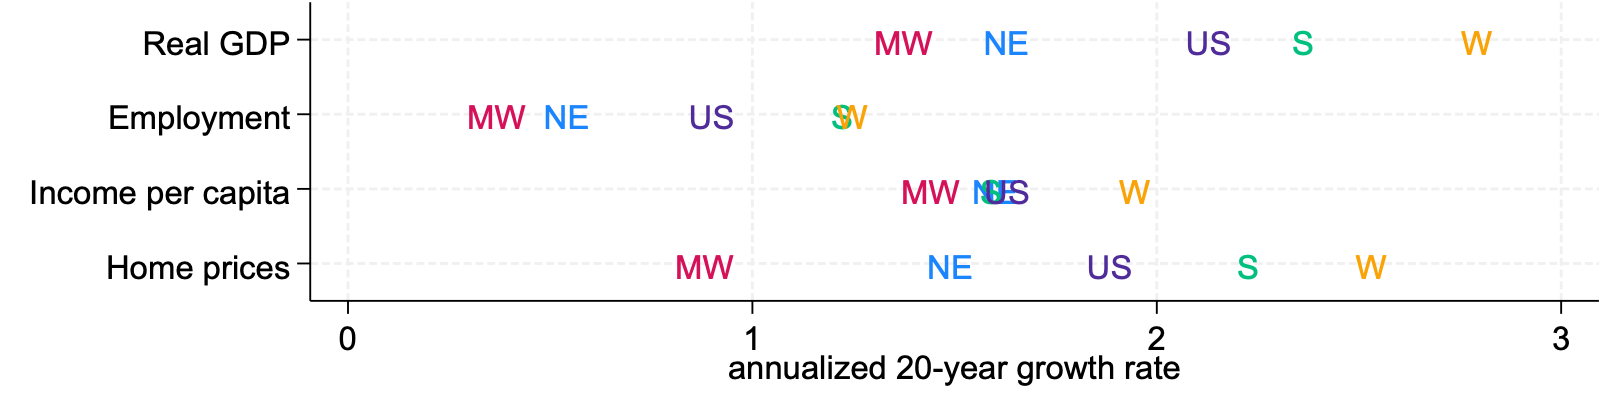
Sources: Author’s calculations based on data from the U.S. Bureau of Economic Analysis, U.S. Bureau of Labor Statistics, and Federal Housing Finance Agency from Haver Analytics.
To make the assessment of closeness more precise, I calculate for each economic growth indicator how far the regions’ values are from the U.S. value. Then, for each region, I take the average of the distances over the four indicators. I measure distance in standard deviations so that indicators with larger ranges of values have the same weight in the average as those with smaller ranges. I take a similar approach for all my subsequent analysis. As an example of the calculation, the Midwest’s annualized real GDP growth rate from 2003 to 2023 was 1.3 standard deviations below the U.S. average; its employment growth rate was also 1.3 below; its income per capita growth rate was 1.0 below; and its home price growth rate was 1.5 below. Therefore, the average distance between and the Midwest and the U.S. for the four indicators is 1.3 standard deviations. The region with the lowest average distance from the U.S. for the four indicators is the South, at 0.5 standard deviations, while the average distance for both the Northeast and West is 0.9 standard deviations. So, the South is closest to the U.S. in terms of economic growth characteristics.
The other economic characteristic I consider is industrial composition, which I assess by calculating employment shares by industry. Figure 2 displays the comparison of employment shares for each of the four Census regions with the U.S. shares. While differences between regions are small for many industries, there are a few noticeable outliers. The largest ones are manufacturing in the Midwest and financial activities and education and health services in the Northeast. To assess closeness, I calculate the average distance for each region’s employment shares from the U.S. values across all industries (again in standard deviations). When I do this, I find the South and West are tied at 0.6 standard deviations; the Midwest’s average distance from the U.S. is 0.9 standard deviations, and the Northeast’s, 1.2.
2. The South and the West are most like the U.S. in terms of industrial composition
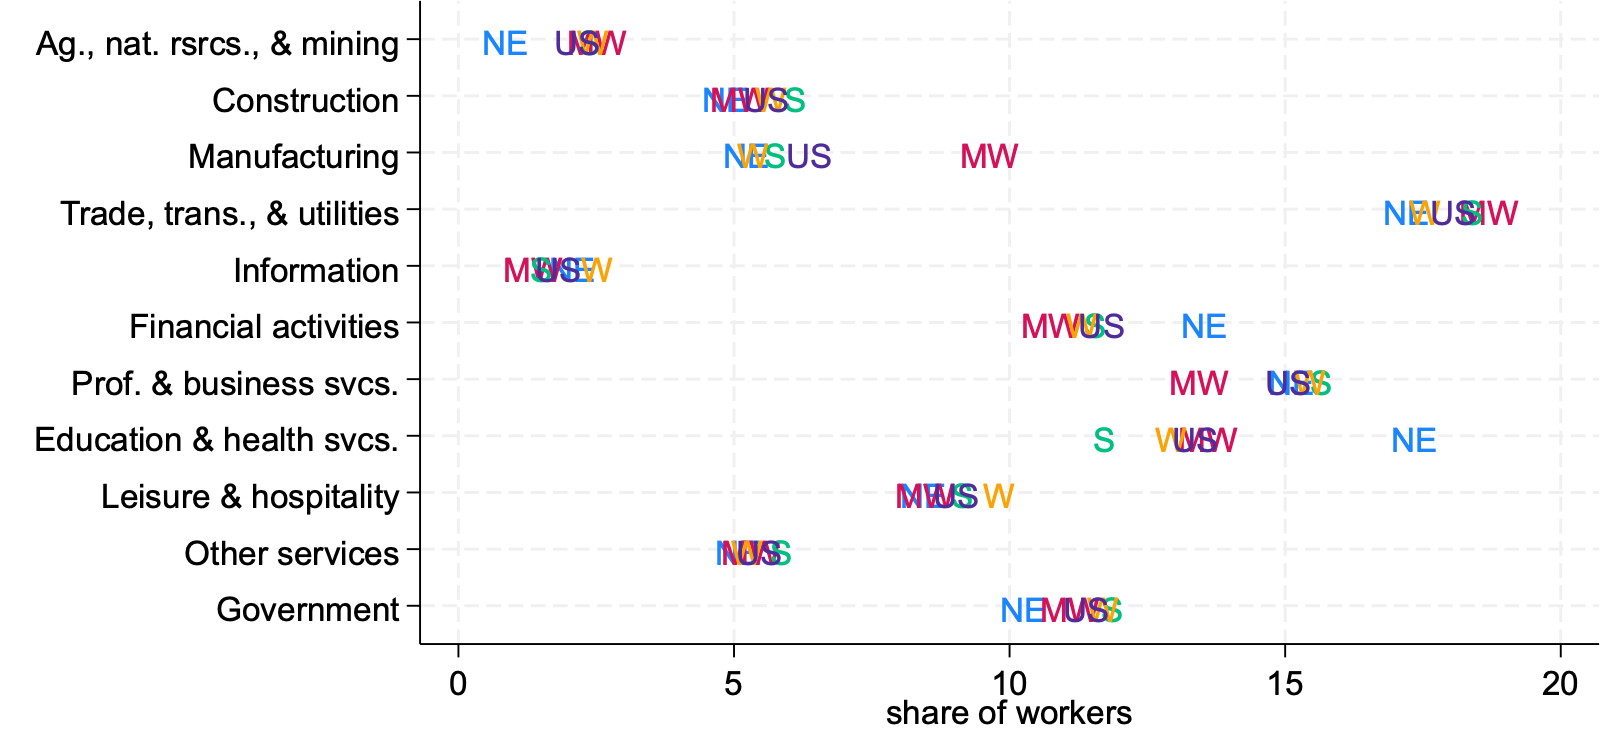
Source: Author’s calculations based on data from the U.S. Bureau of Economic Analysis from Haver Analytics.
Because the South is closest to the U.S. when growth indicators are considered and tied with the West when industrial composition is, the South is the most like the U.S. in terms of economic characteristics. To obtain a ranking of the four regions, I simply take the average of the two averages I calculated separately for the economic growth indicators and industrial composition; the ranking is as follows: the South at 0.5 standard deviations from the U.S., the Northeast at 0.9, the West at 0.9, and the Midwest at 1.1.
The South looks most like the U.S. in terms of population characteristics
I next look at a set of six population characteristics. How similar to the U.S. are the four regions in terms of their age, sex, race and ethnicity, educational attainment, country of origin, and urbanicity distributions? Figure 3 presents panels of shares for the population characteristics as of 2023, and from the figure, a unique and complex profile emerges for each region. The Midwest population is more White, more middle-educated (i.e., has more people with high school diplomas and no college education and more people with some college education without a bachelor’s degree), less foreign born, and less urban than the country as a whole. The Northeast is older, more female, more White, more high-educated (i.e., has more people with a bachelor’s degree or more), less foreign born, and more urban. The South is more female, more Black, more foreign born, and less urban. And the West is younger, more male, more Hispanic, more high- and low-educated (the latter indicating the region has more people without high school diplomas), more foreign born, and more urban.
3. The South is most like the U.S. in terms of population characteristics
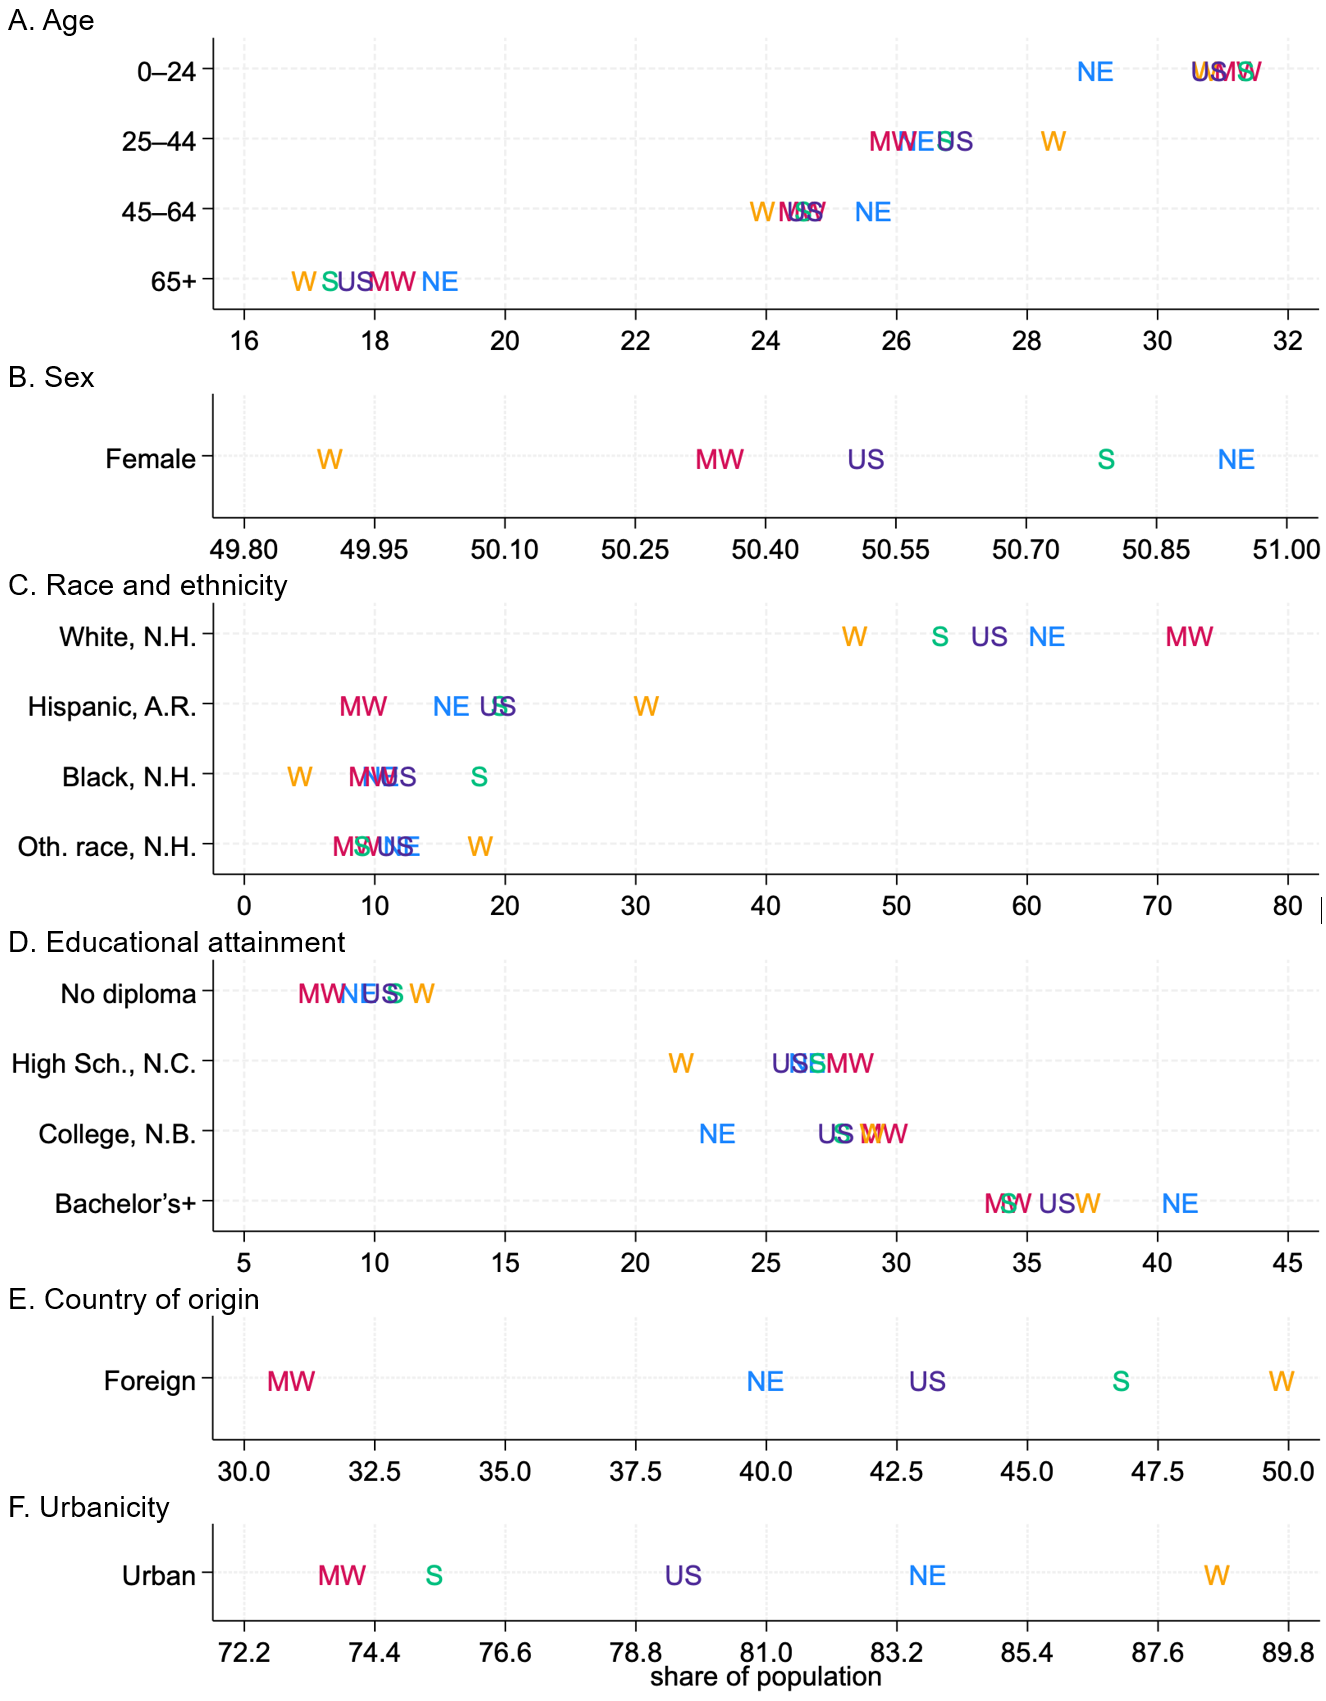
Source: Author’s calculations based on data from the U.S. Census Bureau.
Across all six population characteristics, the South is either first or second closest to the U.S., while the West is first or second furthest except for in educational attainment. The Midwest and Northeast are somewhere in the middle. To obtain an overall ranking of closeness for all the population characteristics, I first calculate average distances for each characteristic and then take the average of the averages. Here are my results: The South, with an overall average distance of 0.5 standard deviations from the U.S., comes in as the closest—followed by the Northeast with a distance from the U.S. of 0.8 standard deviations, the Midwest 0.9, and the West 1.2. This indicates that, as with economic characteristics, the South is closest to the U.S. in terms of population characteristics.
The Midwest looks most like the U.S. in terms of environmental characteristics
The final set of characteristics I examine are environmental ones—i.e., topographic and weather characteristics. There are many possible characteristics to consider, but I focus on ones that economists have previously tested as things people care about when deciding where to live: the presence of shoreline, hills, or mountains; temperatures and sunlight in January; and annual precipitation.1 Of course, when people are deciding where to live, they are primarily searching at the city and neighborhood levels, not the Census region level. The presence of a coast hundreds of miles from a neighborhood has little bearing on the desirability of that neighborhood, even though both may lie in the same Census region. So, to compare the four Census regions with each other and the nation as a whole, I start with county-level data and take averages. To measure how much coastline a region has, I calculate the share of counties that border a major body of water (such as an ocean or one of the Great Lakes). To identify the presence of hills and mountains, I find the median within-county change in elevation among a region’s counties. And for January temperatures, January sunlight, and average annual precipitation, I calculate the average for a region’s counties.
Unlike regions’ economic and population characteristics, there is not a common scale for environmental characteristics, such as a growth rate or population share. So, after obtaining the averages or medians for a characteristic by region, I rescale the measures so that the U.S. value is at 0 and the distance from the U.S. is measured in standard deviations. Figure 4 displays the results, and there are a few features that stick out. First, the West is closer than the other three regions to the average U.S. January temperature because, unlike the others, it includes both northern and southern parts of the nation. Second, the Northeast has much more shoreline and much less January sunlight than other regions. Third, the West is much more mountainous than the other regions. And fourth, the South is much warmer in January than the others.
4. The Midwest is most like the U.S. in terms of environmental characteristics related to population growth
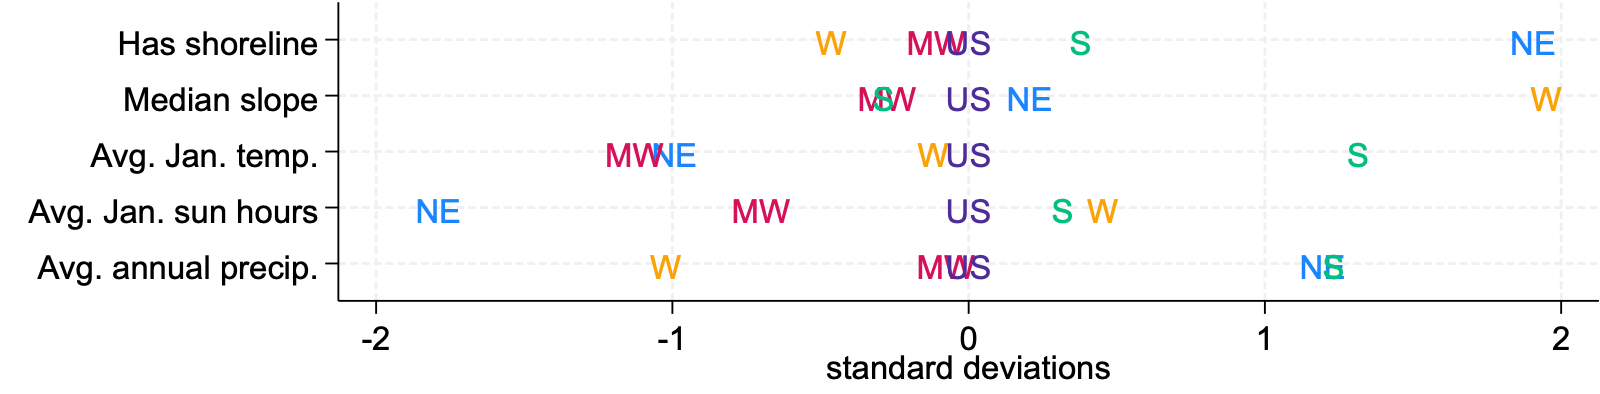
Sources: Author’s calculations based on data from the National Oceanic and Atmospheric Administration, U.S. Department of Agriculture, and U.S. Geological Survey.
While no region is particularly close to the U.S. in all of its environmental characteristics, the Midwest has the lowest average distance across the five characteristics, at 0.5 standard deviations. The South is next at 0.7 standard deviations, then the West at 0.8, and finally the Northeast at 1.2.
Overall, the South is the most like the U.S. as a whole
To figure out which region is most like the nation, I calculate one more average—this time across the three averages for the economic, population, and environmental characteristics. Full results are shown in figure 5. It should be no surprise to see that the South has the lowest overall average, at 0.6 standard deviations, since it has the lowest average for economic and population characteristics and came in second place in terms of environmental characteristics. The Midwest comes in second overall, with an average of 0.8 standard deviations; and the Northeast and West are tied for third at 1.0.
5. The South is overall most like the U.S. in terms of economic, population, and environmental characteristics
| Midwest | Northeast | South | West | |
|---|---|---|---|---|
| Overall | 0.8 | 1.0 | 0.6 | 1.0 |
| Economic | 1.1 | 0.9 | 0.5 | 0.9 |
| Growth | 1.3 | 0.6 | 0.5 | 1.2 |
| Industry mix | 0.9 | 1.2 | 0.6 | 0.6 |
| Population | 0.9 | 0.8 | 0.5 | 1.2 |
| Age | 0.6 | 1.4 | 0.3 | 0.9 |
| Sex | 0.4 | 1.0 | 0.7 | 1.5 |
| Race and ethnicity | 1.0 | 0.3 | 0.6 | 1.4 |
| Educational attainment | 1.0 | 1.1 | 0.4 | 0.9 |
| Country of origin | 1.7 | 0.4 | 0.5 | 0.9 |
| Urbanicity | 0.9 | 0.7 | 0.7 | 1.5 |
| Environmental | 0.5 | 1.2 | 0.7 | 0.8 |
These rankings could, of course, be different if one were to examine a different set of characteristics, use a different measure of closeness to the U.S., or employ a different approach to aggregating the results. But at least for the approach I take in this article, the South is clearly the region that is most like the U.S. as a whole.
Note
1 See, for instance, Linneman and Saiz (2006).


