

In 2024, economic growth slowed for both the United States and the Seventh Federal Reserve District, with growth rates having come in close to their respective ten-year averages.1 District employment continued to grow more slowly than national employment overall, and this was partly due to slower growth rates for the District in the education and health services sector and the manufacturing sector. One bright spot for District employment was the public sector: Employment in the public sector grew faster than in the private sector, making up for several years of relatively slow job gains during the recovery from the Covid-19 pandemic. For 2025, Federal Open Market Committee (FOMC) participants project U.S. growth will continue to slow, but not by much.
Growth slowed some in 2024
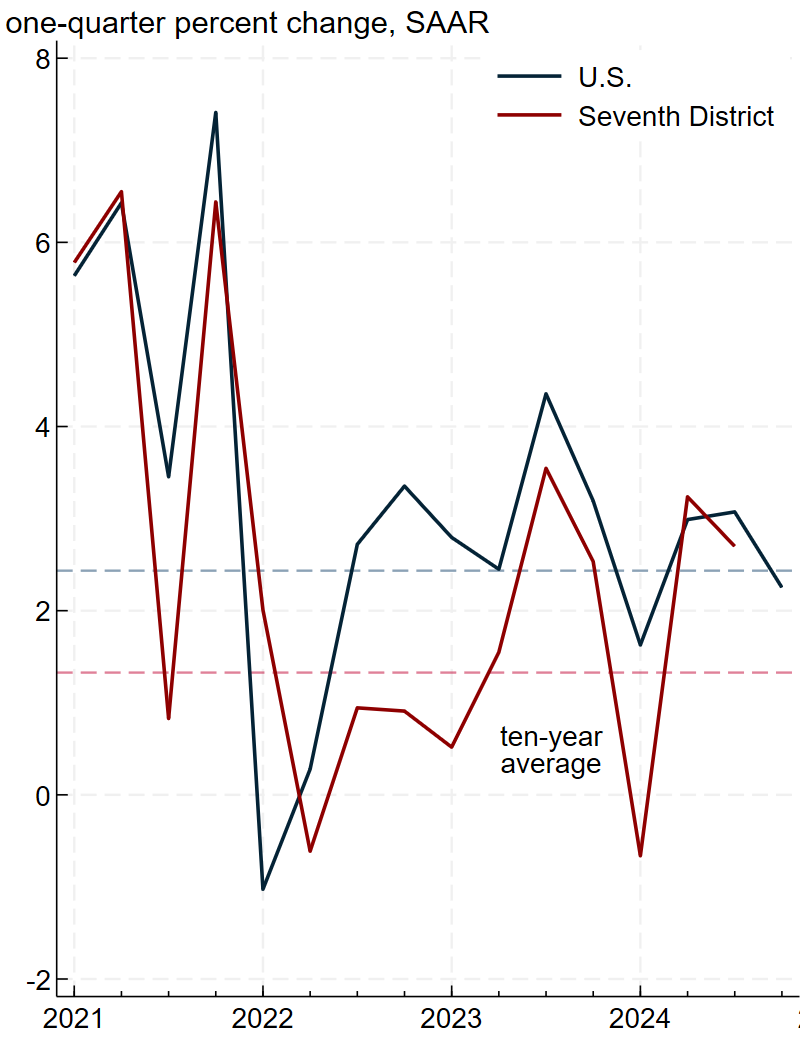
While there were some gyrations throughout the year, economic growth was slower in 2024 than in 2023 for both the nation and the Seventh District. Panel A of figure 1 shows annualized real gross domestic product (GDP) growth by quarter for the U.S. (in blue) and the Seventh District (in red), along with ten-year averages calculated as a compound annual growth rate (CAGR).2 Real GDP growth rates in the U.S. and District were quite low in the first quarter of 2024 (falling into negative territory in the District), but bounced back in the second quarter and were quite good for the remainder of the year (we will not have fourth quarter GDP data for the Seventh District until late March 2025). If we average across the quarters by year (by calculating the CAGR), we find that national real GDP grew by 3.2% in 2023 and 2.5% in 2024; in both years, the real GDP growth rate was somewhat above the ten-year average of 2.4%. Real GDP growth was slower in the District, where the average rate was 2.0% in 2023 and 1.7% through the third quarter of 2024. However, District real GDP growth in 2023 and 2024 was above its ten-year average of 1.3%.
Trends in employment growth in 2024 were broadly similar to trends in real GDP growth, as shown in panel B of figure 1. Averaging by year using the CAGR formula (in note 2), we find the nation’s employment growth rate was 1.2% in 2024—down from 1.7% in 2023 and slightly lower than the ten-year average of 1.3%.3 In addition, we find that District employment growth was 1.0% in 2024—up a bit from the 0.9% increase in 2023, which was comfortably above the ten-year average of 0.6%.
1. Real growth domestic product (GDP) and nonfarm payroll employment growth in the U.S. and the Seventh District
A. Real GDP
B. Employment
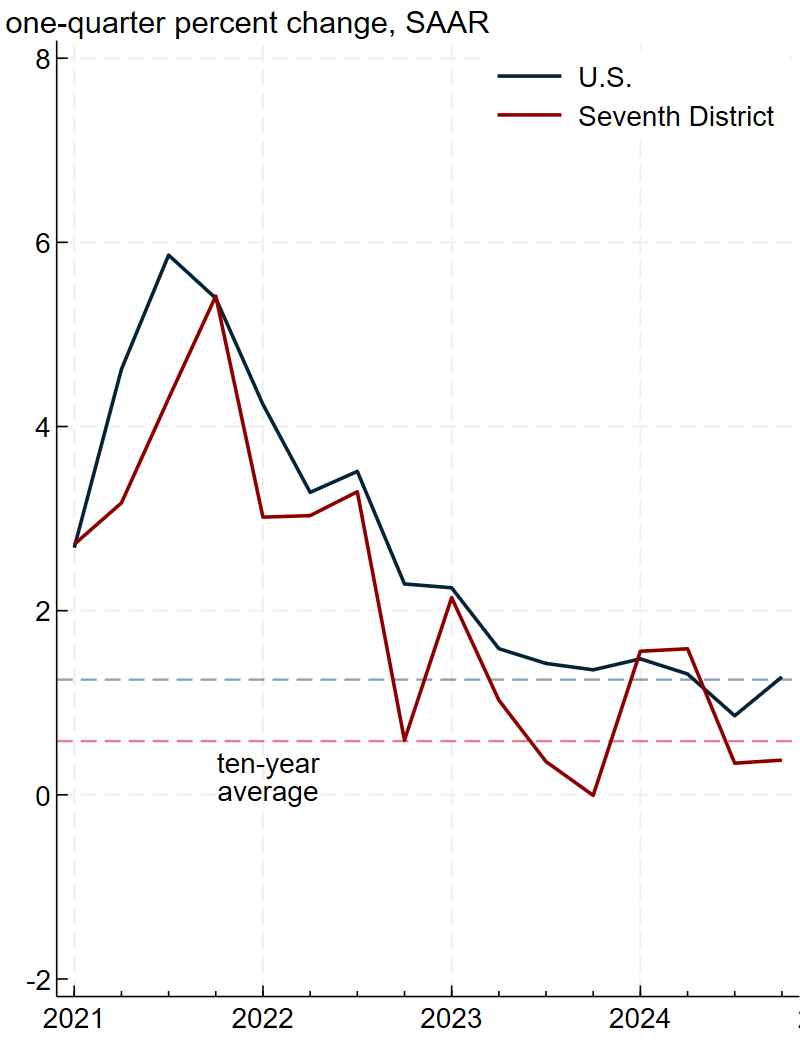
Sources: Authors’ calculations based on data from the U.S. Bureau of Economic Analysis and U.S. Bureau of Labor Statistics from Haver Analytics.
Relatively slower growth in Seventh District employment was driven by the education and health services and manufacturing sectors
In 2024, District employment growth was about 0.3 percentage points slower than national employment growth. In this section, we decompose that difference by industry to see which sectors contributed most to it. Figure 2 displays the decomposition. We start with the top contributor to the difference in employment growth between the U.S. and the District: education and health services.4 Over the course of 2024, this sector’s employment grew at a healthy clip of 2.20% in the District (first column of data) but by a much larger 3.85% in the U.S. (second column). To calculate the sector’s contribution to each area’s overall growth, we multiply the growth rates by the employment shares in the third and fourth columns. The U.S. has a larger share of employment in education and health services than the District does, which amplifies the growth rate differential. In figure 2, the fifth and sixth columns of data show that education and health services contributed 0.35 percentage points to overall employment growth in the District, but a much larger 0.64 percentage points to the overall employment growth in the nation. The 0.29 percentage point difference in contributions (as shown in the final column of figure 2) explains a large portion of the total difference in employment growth rates between the District and the nation.
2. Employment growth by industry, December 2023–December 2024
| Growth rate | Employment share | Contribution to growth | |||||||
|---|---|---|---|---|---|---|---|---|---|
| Seventh District | United States | Seventh District | United States | Seventh District | United States | Difference | |||
| All industries | 0.95 | 1.27 | 100.0 | 100.0 | 0.95 | 1.27 | 0.32 | ||
| Education and health services | 2.20 | 3.85 | 15.7 | 16.5 | 0.35 | 0.64 | 0.29 | ||
| Manufacturing | –1.42 | –0.83 | 13.2 | 8.2 | –0.19 | –0.07 | 0.12 | ||
| Financial activities | –0.46 | 0.40 | 5.7 | 5.8 | –0.03 | 0.02 | 0.05 | ||
| Trade, transportation, and utilities | 0.40 | 0.58 | 19.2 | 18.4 | 0.08 | 0.11 | 0.03 | ||
| Professional and business services | –0.40 | –0.24 | 13.1 | 14.4 | –0.05 | –0.04 | 0.02 | ||
| Mining, logging, and construction | 2.45 | 1.98 | 4.5 | 5.6 | 0.11 | 0.11 | 0.00 | ||
| Leisure and hospitality | 1.77 | 1.51 | 9.5 | 10.7 | 0.17 | 0.16 | –0.01 | ||
| Information | 1.13 | –0.64 | 1.3 | 1.9 | 0.01 | –0.01 | –0.03 | ||
| Other services | 2.66 | 1.66 | 4.1 | 3.8 | 0.11 | 0.06 | –0.05 | ||
| Government | 2.84 | 1.95 | 13.7 | 14.7 | 0.39 | 0.29 | –0.10 | ||
Another key contributor to the difference in 2024 employment growth rates between the District and the U.S. was the manufacturing sector. Manufacturing employment decreased in both the U.S. and District, but the decline was much larger for the District. In addition, the difference in contributions to overall employment growth is amplified because the District has a much larger share of employment in manufacturing than the nation does. Relative to the District, the U.S. had higher employment growth rates in and received larger contributions to employment growth from five of the ten sectors. One sector that bucked the District’s slower employment growth trend in 2024 was government, and in the next section, we explore why.
In the Seventh District, the public sector caught up with the private sector in its employment recovery from the pandemic
Not only did government employment in the District grow faster than in the nation, the growth rate of 2.84% (see the final row of figure 2) was historically high. In the five years prior to the pandemic, District government employment grew at an average annual rate of just 0.2%. The sector’s high 2024 growth rate was likely related to the unique impact of the pandemic on government employment trends. Figure 3 displays employment levels since February 2020 (indexed to that date) for the public sector (red) and private sector (blue) for both the U.S. (solid) and Seventh District (dashed). There are a couple of clear relationships between the lines. First, both Seventh District lines lag their U.S. counterparts, reflecting the District’s relatively slower growth. Second, in the U.S., private sector employment returned to its pre-pandemic level much sooner than public sector employment (which lagged about six quarters); and a similar pattern was seen in the District. In the Seventh District, public sector employment relative to February 2020 is now at the same level as private sector employment; and while there is a gap between the public and private sector levels for the U.S., the gap has shrunk some over the past couple of years.
3. Payroll employment in the U.S. and Seventh District, by private and public sectors
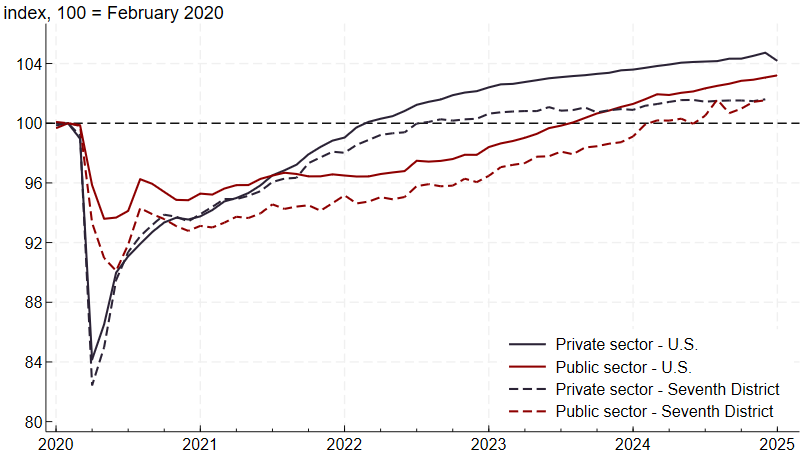
Source: Authors’ calculations based on data from the U.S. Bureau of Labor Statistics from Haver Analytics.
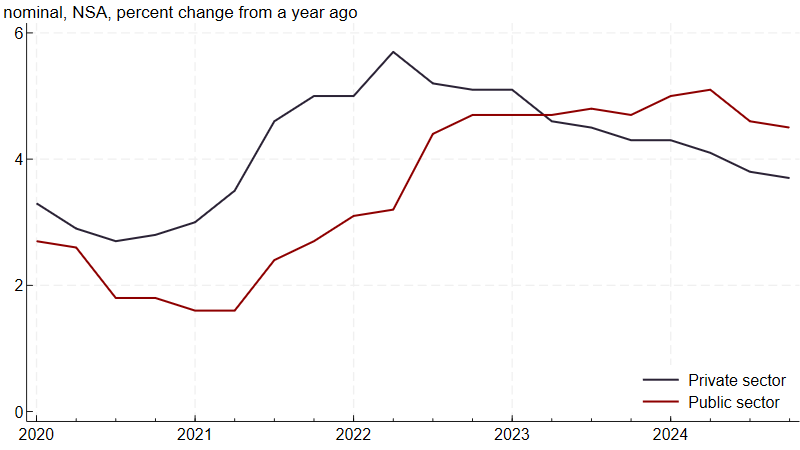
Relatively higher wage growth has accompanied the public sector’s relatively stronger employment growth over the past couple of years. Figure 4 shows that when wage growth (as measured by the Employment Cost Index from the U.S. Bureau of Labor Statistics) started accelerating in 2021, it accelerated much more in the private sector than in the public sector5 (for more on the run-up in wage growth in 2021 and 2022, see this Chicago Fed Letter). More recently, though, public sector wage growth has surpassed that of the private sector, indicating that public sector wage gains since 2020 are catching up to those of the private sector.
4. Employment Cost Index for private and public sector employees
Recent growth patterns are projected to continue in the year ahead
While U.S. real GDP growth slowed to 2.5% in 2024 from 3.2% in 2023, it remained above the median FOMC participant’s estimate of the longer-run growth rate of 1.8%, according to the December 18, 2024, Summary of Economic Projections. At the December 2024 FOMC meeting, FOMC participants updated their economic projections for 2025, and broadly speaking, they expected more of the same. FOMC participants’ median projection was for U.S. real GDP to grow by 2.1% in 2025, which represents further slowing, but is still slightly above the estimated longer-run rate. As for the District, we believe its trajectory relative to the U.S. economy will continue in 2025, with economic growth remaining positive but below the U.S. rate.
Notes
1 The Seventh Federal Reserve District (which is served by the Chicago Fed) comprises all of Iowa and most of Illinois, Indiana, Michigan, and Wisconsin. In this article, we analyze the entirety of each state in the District.
2 The compound annual growth rate is the fixed rate of growth that transforms the level at the start of the reference period to the level at the end. The formula is . This formula is used to calculate the yearly average and ten-year average for both real GDP growth and employment growth.
3 Annual revisions to national estimates of employment, hours, and earnings were released on February 7, 2025. The data and calculations in this article include the revised national data. State-level revisions will not be released until March 17, 2025, which means that differences between District and national employment trends may shift.
4 This sector includes only private education and health service organizations. Employment at public education and health service providers is included in the government sector.
5 For the Employment Cost Index, the public sector includes all state and local government workers.


