

The following publication has been lightly reedited for spelling, grammar, and style to provide better searchability and an improved reading experience. No substantive changes impacting the data, analysis, or conclusions have been made. A PDF of the originally published version is available here.
The performance of the U.S. rural economy has varied significantly from that of urban areas in recent years. After growing at a rate similar to urban areas in the 1970s, rural America fell behind in the 1980s. However, a look at some broad measures of population and income growth suggests the rural economy is picking up steam in the current decade. In general, recent gains for rural areas have closely paralleled, and in some cases even exceeded, those of urban areas. In particular, rural population growth has experienced a remarkable turnaround in this decade. The changing fortunes of rural areas naturally raise questions about the factors that have prompted the recent improvement. For example, how do the changes in agriculture, manufacturing, and other sectors affect the economic welfare of rural residents? And more importantly, can the recent improvement in rural economic performance be sustained? The answers to these questions will help rural residents and policymakers cope with change and find prosperity in the future.
To better understand the challenges facing rural areas, the Federal Reserve Bank of Chicago hosted a conference earlier this year to evaluate the recent performance and future prospects of the Midwest rural economy. The conference was part of a yearlong project examining different facets of economic performance in the Midwest. The topics discussed at the conference on the rural economy included population trends in rural and urban areas; the quality of rural education; developments in rural service industries (producer, health care, retirement, and recreation); the ongoing structural change occurring in production agriculture; and trends in rural manufacturing. In addition, the food processing industry was closely examined during the workshop due to its strong ties to the agricultural sector and rural areas. In this Chicago Fed Letter, we describe the recent performance of food processing firms in the states of the Seventh Federal Reserve District (Illinois, Indiana, Iowa, Michigan, and Wisconsin) and discuss some of the immediate challenges facing these firms.
Food processors make an important contribution to the economy—at both the District and national levels—in a variety of ways. As perhaps the principal link in the food marketing chain, food processors typically undertake the initial transformation of raw agricultural commodities to high-quality food products. They are an especially important part of the rural landscape, with a greater tendency to locate plants and employment in rural areas than other manufacturers. Approximately 40% of food manufacturing plants are in rural areas, compared to less than 23% for other types of manufacturing. Food processing firms also play a major role in the District's industrial sector. Among the 20 major manufacturing groups, food processing in District states ranks second in sales and value added and fifth in employment.1 In international trade, the gains in consumer food exports have been much more dependable in recent years than the foreign sales of either intermediate-value or bulk agricultural products, which tend to suffer much wider year-to-year variations. Furthermore, long-term forecasts released by the U.S. Department of Agriculture predict more rapid gains for manufactured food exports relative to bulk commodities well into the next century, despite the recent boom in commodity exports. Finally, some analysts have suggested that formal agricultural and food policy goals be changed to put greater emphasis on international competitiveness, improved nutrition, increased rural economic opportunity, and natural resource conservation.2 Food processors would naturally play an important role in the implementation of these types of policy goals.
An important characteristic of the food processing industry in District states is its ties to the region's production agriculture. This is evident from figure 1, which lists the major food processing industries in the region in terms of value added. The linkages of many of these industries—such as corn milling, cheese production, and meat packing—to the District's production agriculture are quite obvious. Some are not so clear. For example, confectionery and soft drinks are large-scale users of corn sweeteners, a product of corn milling. Frozen specialties are heavy users of meat and vegetable products in frozen dinners and meat and cheese in frozen pizzas. Although figure 1 lists only 15 of the nearly 50 industries in the food processing sector, these 15 industries account for nearly three-quarters of the economic activity that stems from food processing in District states. Given the role of District agriculture in livestock production (District states account for about 45% of hogs on farms and about 10% of beef cattle in the U.S.), it is noteworthy that meatpacking's ranking dropped from first to sixth during the 1982–92 period. The lack of growth in meatpacking relative to other industries reflects the District's declining share of beef production since the early 1970s. However, this development was somewhat offset by growth in meat processing, an activity that adds extra value to meat products at the processor level in response to the desire shown by consumers for greater convenience and variety at the retail level.
1. Seventh District's top 15 food processing industries
| Rank | Value added ($ billion) | % of all District food processing | |||||
|---|---|---|---|---|---|---|---|
| Industry | 1982 | 1992 | 1982 | 1992 | 1982 | 1992 | |
| Breakfast foods | 3 | 1 | 1.26 | 3.47 | 6.9 | 10.6 | |
| Confectionery | 2 | 2 | 1.47 | 2.49 | 8.0 | 7.6 | |
| Wet corn milling | 5 | 3 | 0.90 | 2.39 | 4.9 | 6.7 | |
| Cheese | 8 | 4 | 0.79 | 2.19 | 4.3 | 6.7 | |
| Meat processing | 7 | 5 | 0.80 | 1.85 | 4.4 | 5.7 | |
| Meat packing | 1 | 6 | 1.56 | 1.74 | 8.5 | 5.3 | |
| Processed milk | 9 | 7 | 0.78 | 1.69 | 4.3 | 5.2 | |
| Soft drinks | 6 | 8 | 0.85 | 1.65 | 4.6 | 5.1 | |
| Bread | 4 | 9 | 1.11 | 1.48 | 6.1 | 4.5 | |
| Cookies and crackers | 15 | 10 | 0.52 | 1.21 | 2.8 | 3.7 | |
| Canned fruits & vegetables | 17 | 11 | 0.50 | 0.94 | 2.7 | 2.9 | |
| Flavorings | 16 | 12 | 0.52 | 0.90 | 2.8 | 2.8 | |
| Fluid milk | 14 | 13 | 0.55 | 0.89 | 3.0 | 2.7 | |
| Frozen specialties | 18 | 14 | 0.39 | 0.86 | 2.1 | 2.6 | |
| Animal feeds | 13 | 15 | 0.39 | 0.86 | 2.1 | 2.6 | |
| Top 15 | 12.58 | 24.48 | 68.7 | 74.9 | |||
| All food processing | |||||||
| District states | 18.31 | 32.69 | 100 | 100 | |||
| U.S. | 88.42 | 156.84 | |||||
Given the diversity of food processors in District states, and given that growth trends in economic activity and employment are important gauges of a region's economic well-being, which food processing industries were the best performers for the District in recent years? Which showed the least staying power? We examined the value added and employment growth for these industries from 1982–92 and categorized them as follows: If an industry ranked in the top 15 both in terms of value-added growth and in terms of employment growth, it was termed a high performer; those that ranked in the bottom 15 in both categories were designated low performers (see figure 2). Of the eight industries classified as high performers, five are relatively large, together accounting for over one-fifth of the value added by District food processors in 1992. These are poultry processing, meat processing, cheese production, processed milk, and frozen specialties. These industries not only registered significant gains from 1982–92 but did so from relatively large initial bases. In comparison, none of the low performers was among the District's major food processing industries.
2. High/low performers 1982-92
| Employment | Value added | |
|---|---|---|
| (percent change) | ||
| High performers | ||
| Flour mixes | 98 | 167 |
| Poultry processing | 83 | 249 |
| Cheese | 31 | 178 |
| Ice cream | 14 | 224 |
| Frozen fruits and vegetables | 33 | 97 |
| Frozen specialties | 18 | 119 |
| Meat processing | 32 | 131 |
| Processed milk | 14 | 116 |
| Low performers | ||
| Spirits | -39 | -5 |
| Beer | -61 | -9 |
| Dried fruits and vegetables | -39 | -9 |
| Pasta | -37 | -12 |
| Cooking oils | -37 | -29 |
| Pet food | -49 | -35 |
| Pickles and sauces | -15 | 17 |
| Flour | -18 | -2 |
| Beet sugar | -27 | 21 |
| Frozen fish | -71 | 24 |
| All food processing | ||
| District states | -5 | 78 |
| U.S. | 1 | 77 |
Another useful way to examine food processors is by their tendency to locate production plants near sources of input supplies or demand points. A supply-oriented firm or industry tends to locate near the source of raw agricultural inputs, most likely because those commodities are perishable and/or expensive to transport. Cheese manufacturing, wet corn milling, soybean processing, and meatpacking are among the industries included in this category. For example, the primary input in cheese production is milk, which is bulky, costly to move, and subject to bacterial contamination. It is much more efficient and effective to conduct processing activities near areas of milk production and then ship the final products to demand points. Supply-oriented food industries predominate in District states and are a direct reflection of the region's strong production agriculture base. These industries account for half the employment and value added that stem from the region's food processing activities.
In comparison, a demand-oriented industry is more inclined to locate manufacturing plants near population centers (or in the case of livestock feeds, areas of livestock concentration), because distribution costs of the final product are relatively large. Examples include bread, soft drinks, and pasta. In the case of bread manufacturing, the output is rather bulky relative to its weight and freshness may also be an issue. Each District state has a significant bread manufacturing industry, yet none of these states is a major producer of wheat. Furthermore, the share of bread production held by each state tends to parallel its share of District population. Demand-type firms account for 24% of employment and a somewhat smaller share of value added among all District food processors.
In contrast, footloose industries are less likely to be constrained by transportation costs. This group also includes those industries not easily categorized as supply- or demand-oriented, such as frozen specialties, candy and confectionery, and flavorings. Firms in these industries put relatively more emphasis on factors such as taxes, utility costs, infrastructure, and the availability and cost of labor and services when making plant location decisions.
This implies there would be a bias toward locating or expanding in areas that are favorable to manufacturing firms in general. Given the strong presence of other manufacturers in District states, it seems the region would be an attractive location for food industries that are not closely tied to input supply areas or demand centers. Footloose firms account for one-fifth of food processing employment in District states but a larger share (about one-third) of value added.
In general, supply-oriented food industries were the best performers among all District food processors over the decade to 1992. Both employment and value added made solid gains. Firms in the footloose industries nearly matched this performance in terms of value added but registered an employment decline. However, those enterprises in demand-oriented industries lost ground in both value added and employment during the same period. The likely cause of this relatively low performance is the link between demand-oriented firms and the local/regional population. Population growth in District states was less than stellar from 1982–92, about 3% (compared to 10% for the entire U.S.), which encouraged only modest growth in nominal sales for the demand-oriented group. Furthermore, transportation costs may constrain these firms from competing for rising demand in distant markets.
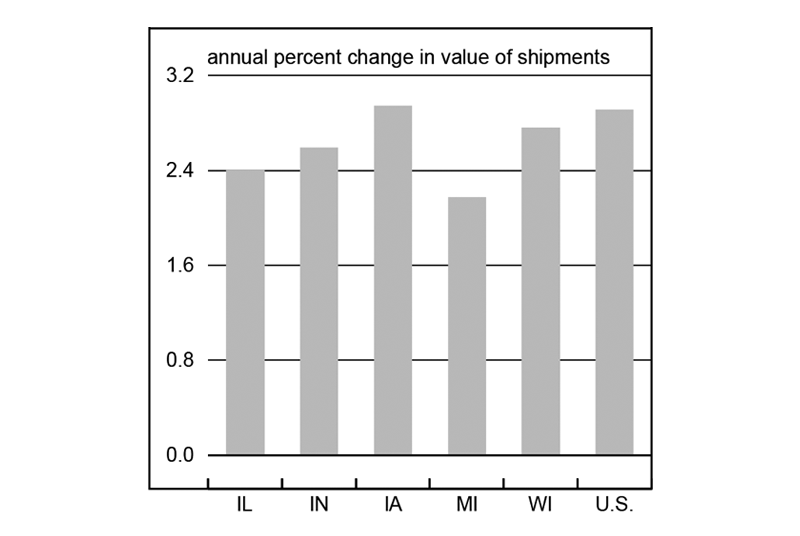
From 1982–92, the value added for all food processors in District states expanded at a rate similar to that for the U.S. as a whole. But what is the potential for future growth in District food processing relative to other geographical areas? To shed some light on this question, we used a simple statistical model to predict regional sales growth. The results for District states are shown in figure 3. Previous research indicates that a significant portion of the variation in growth across regions stems from differences in population growth and annual wages. Population change represents an important demand indicator, while labor is a significant unit cost component. Using these variables as predictors suggests that food processing growth in District states will tend to lag overall food processing growth in the U.S. through the turn of the century. This is because annual wages paid by District processors are somewhat higher than the U.S. average, while the region's population growth is expected to lag the rest of the nation. However, this approach may underestimate future growth for District food processors, because it fails to account fully for the recent expansion of food product sales in foreign markets.
3. Predicted growth, 1992-2002
Conclusion
In addition to wage and population differentials, District food processors face other challenges that will affect their performance and their ability to provide jobs for District and rural residents. These challenges include declining grain stocks, changes in farm policy, and structural changes in regional livestock production. For example, the greatest gains in hog production in recent years have been concentrated in states outside the Midwest. If this trend continues, the Midwest could lose its dominance in pork processing, similar to its loss of beef processing in the 1970s. A similar situation exists for milk processing and cheese production because the Midwest's share of milk production has declined.
Furthermore, the recent shifts in farm policy will result in a more uncertain environment for food processors. Over the past decade, farm policy has steadily become more market oriented. Partly as a result, domestic grain stocks have declined. In addition, the 1996 farm bill provided for the separation of planting decisions and program payments, raising the potential for larger year-to-year swings in the acres planted to individual crops such as corn, wheat, and soybeans. Consequently, food processors can expect to face greater variability in available grain supplies and in prices. The recent increase in grain prices—resulting from a moderate production decline and vigorous demand—may provide a glimpse of a more volatile future. For example, ethanol producers recently announced production cutbacks due to high corn prices and smaller available corn supplies.
Finally, research by analysts at the U.S. Department of Agriculture suggests that both capital expenditures and productivity gains of rural manufacturers tend to lag those of firms in urban areas. This would tend to limit future gains in output and wages paid by rural firms relative to urban firms. Food processors, with their strong rural ties, are more likely to fit this profile than other manufacturers. How they deal with these challenges will have important implications for jobs and wages in rural communities.
Tracking Midwest manufacturing activity
Manufacturing output indexes (1987=100)
| June | Month ago | Year ago | |
|---|---|---|---|
| MMI | 148.1 | 147.4 | 140.8 |
| IP | 127.6 | 126.9 | 123.3 |
Motor vehicle production (millions, seasonally adj. annual rate)
| July | Month ago | Year ago | |
|---|---|---|---|
| Cars | 7.0 | 6.7 | 6.2 |
| Light trucks | 6.0 | 5.4 | 4.6 |
Purchasing managers' surveys: net % reporting production growth
| July | Month ago | Year ago | |
|---|---|---|---|
| MW | 50.9 | 60.7 | 46.4 |
| U.S. | 52.7 | 55.4 | 52.1 |
Motor vehicle production (millions, seasonally adj. annual rate)
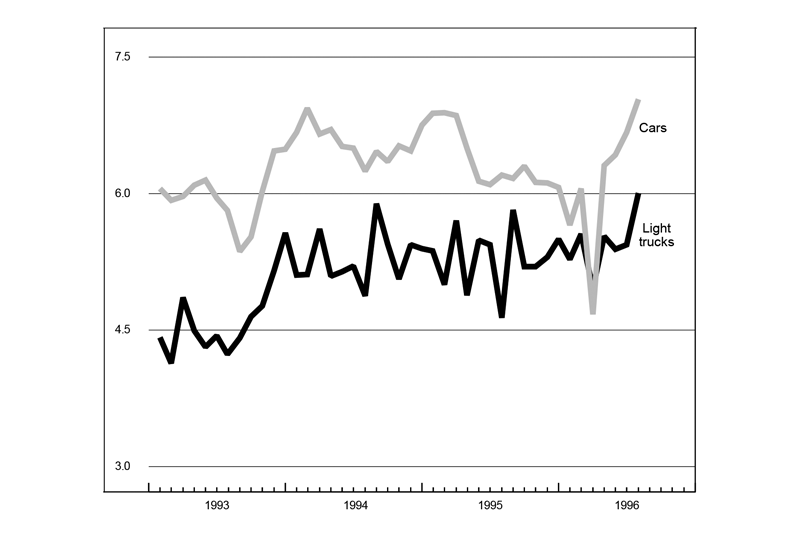
Midwest manufacturing activity continued to be buoyed by auto production in July, although some slowing in the overall pace of manufacturing activity was apparent. Light vehicle (cars and light trucks) production continued to expand, reaching 13 million units in July from 12.1 million units in June. Auto producers have been attempting to rebuild stock, accounting for the continued strength in assemblies, but some inventory building as a hedge against a strike in September (when the current UAW contract expires) is also possible.
The composite purchasing managers' index for production in the Midwest dropped sharply in July but still remained above the 50 mark (the level at which activity is flat). The national purchasing managers' index also slowed from its June pace but signaled a somewhat stronger expansion than the Midwest index for the first time since July 1995.
Notes
1 Value added represents the value of production less materials cost. It is useful as a measure of economic activity because it avoids the double counting that may occur when adding together the sales of different industries. For example, an end product of wet corn milling—high fructose corn syrup—is also a production input for soft drink manufacturing.
2 See Drabenstott, Mark, and Alan Barkema, “A new vision for agricultural policy,” Economic Review, Federal Reserve Bank of Kansas City, Third Quarter, 1995, pp. 63–78.


