

Read our AgLetter Insights Q&A with author David Oppedahl for further insights into Seventh District farmland values and agricultural credit conditions described in this issue of AgLetter.
Summary
With no change in the third quarter of 2024 from a year ago, agricultural land values for the Seventh Federal Reserve District stalled after 18 quarters of year-over-year increases. Moreover, values for “good” farmland in the District overall were 2 percent lower in the third quarter of 2024 than in the second quarter, according to the respondents from 119 banks who completed the October 1 survey. While 64 percent of the survey respondents anticipated District farmland values to be stable during the fourth quarter of 2024, just 2 percent anticipated them to move up in the final quarter of this year and 34 percent anticipated them to move down.
The District’s agricultural credit conditions weakened on balance in the third quarter of 2024 relative to a year earlier, although average interest rates on agricultural loans decreased from the second quarter of this year. Repayment rates for non-real-estate farm loans compared with the same quarter of the previous year were down once more. In addition, renewals and extensions of such loans were above the level of a year ago. In the third quarter of this year, demand for non-real-estate farm loans was up relative to a year ago for the fourth consecutive quarter, while the availability of funds for lending by agricultural banks was down relative to a year ago for the sixth consecutive quarter. Lastly, the average loan-to-deposit ratio for the District dipped to 75.7 percent in the third quarter of 2024.
Farmland values
The District had no year-over-year change in its agricultural land values in the third quarter of 2024. This was the first period without a year-over-year increase in District farmland values since the fourth quarter of 2019. Wisconsin had another year-over-year gain in farmland values (but of only 4 percent); Illinois, Indiana, and Iowa had year-over-year decreases in farmland values (see map and table below). According to an Indiana respondent, “Inventory of farmland for sale in the area is still low.” After being adjusted for inflation with the Personal Consumption Expenditures Price Index (PCEPI), District farmland values were down 2 percent in the third quarter of 2024 relative to a year ago. In nominal terms, the District’s agricultural land values in the third quarter of 2024 were 2 percent lower than in the second quarter.
Percent change in dollar value of “good” farmland
| July 1, 2024 to October 1, 2024 |
October 1, 2023 to October 1, 2024 |
|
|---|---|---|
| Illinois | –5 | –1 |
| Indiana | –1 | –2 |
| Iowa | +1 | –1 |
| Michigan | * | * |
| Wisconsin | –3 | +4 |
| Seventh District | –2 | 0 |
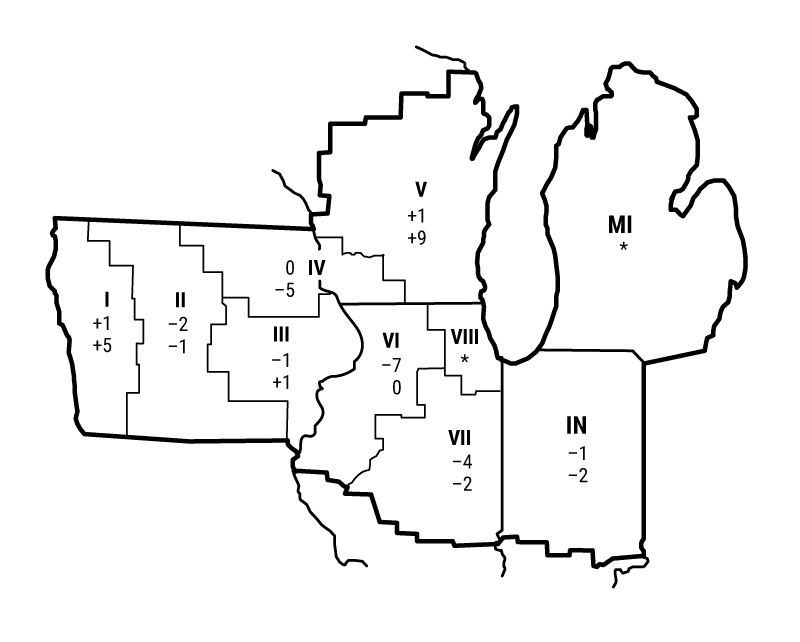
Top: July 1, 2024 to October 1, 2024
Bottom: October 1, 2023 to October 1, 2024
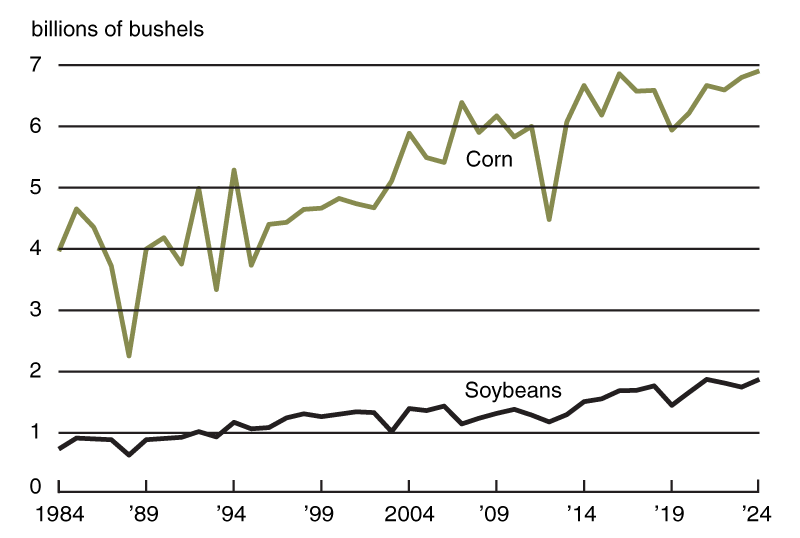
Although dryness spread across the District for much of the latter half of the growing season, timely rains pushed corn and soybean production to record highs for the five states in the District in 2024, based on U.S. Department of Agriculture (USDA) data (see chart 1). The USDA forecasted the five District states’ harvests of corn for grain and soybeans in 2024 to increase by 1.6 percent and 7.2 percent, respectively, from their 2023 harvests. The corn yield for the five District states also set a record in 2024, based on November USDA data; the District soybean yield was just shy of its 2021 record. With the U.S. corn harvest projected just below 2023’s record, the price of corn in September 2024 was 24 percent lower than a year ago; with a near record U.S. harvest of soybeans projected, their price in September of this year was 23 percent lower than a year earlier (see the final table). In November, the USDA released price forecasts for the 2024–25 crop year of $4.10 per bushel for corn and $10.80 per bushel for soybeans. When calculated using these price estimates, the projected revenues from the District states’ 2024 combined corn and soybean harvests would be 7.7 percent under 2023’s level, which was already 24 percent lower than 2022’s record revenue total.
1. Corn and soybean production in the Seventh District states
In contrast, the USDA price index for livestock and animal products was 10 percent higher in September 2024 than a year earlier (again, see the final table). Compared with a year ago, average prices for cattle, eggs, and milk in September 2024 were up 1 percent, 71 percent, and 22 percent, respectively. September hog prices were down 2 percent from a year earlier. An Iowa banker stated that “low crop prices and prolonged losses in hog enterprises are combining to create an earnings decline for 2024.” Despite stronger overall livestock returns, the majority of District farms faced concerns about profitability in 2024, putting a drag on farmland values.
Credit conditions
Agricultural credit conditions for the District softened in the third quarter of 2024. Agricultural interest rates—in both nominal and real terms—fell slightly during the third quarter of this year. In the third quarter of 2024, the District’s average nominal interest rates on new operating loans (8.12 percent), feeder cattle loans (8.09 percent), and farm real estate loans (7.19 percent) had all fallen to their lowest levels since the first quarter of 2023. Meanwhile, in real terms (after being adjusted for inflation with the PCEPI), the average interest rates on farm operating, feeder cattle, and farm real estate loans exhibited their first decline since beginning their run-ups back in the first quarter of 2022.
For the July through September period of 2024, repayment rates for non-real-estate farm loans were lower than a year earlier. The index of loan repayment rates was 76 in the third quarter of 2024 (and was last lower in the second quarter of 2020), as 3 percent of responding bankers observed higher rates of loan repayment than a year ago and 27 percent observed lower rates. Renewals and extensions of non-real-estate agricultural loans were higher in the third quarter of 2024 than a year ago, with 32 percent of the responding bankers reporting more of them and 4 percent reporting fewer. An Illinois banker noted that “low grain prices are definitely affecting borrowers’ ability to pay off operating loans.” Collateral requirements for loans in the third quarter of 2024 also rose from the same quarter of last year; 15 percent of the survey respondents reported that their banks required more collateral, while none reported that their banks required less.
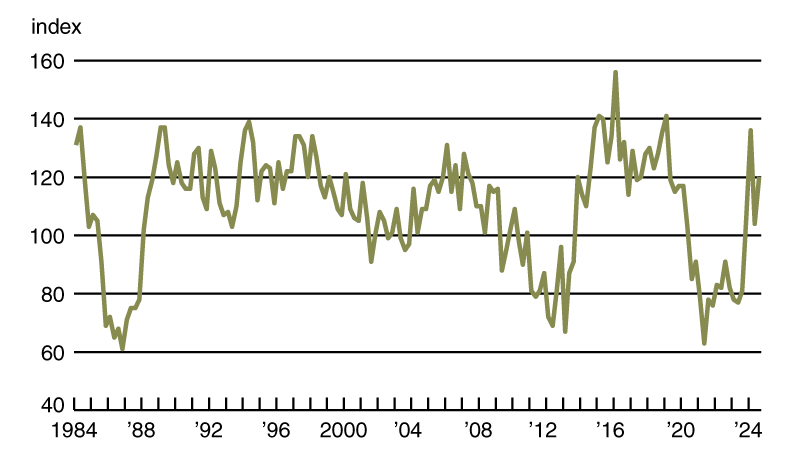
In the third quarter of 2024, the District saw stronger demand for non-real-estate farm loans relative to a year ago—this marked the fourth consecutive quarter of stronger demand (see chart 2). The index of loan demand was 120 in the third quarter of 2024, as 40 percent of survey respondents noted higher demand for non-real-estate farm loans than a year earlier and 20 percent noted lower demand. The availability of funds for lending by agricultural banks was lower than a year ago for the sixth quarter in a row. The index of funds availability was 92 in the third quarter of 2024, as just 8 percent of the survey respondents indicated their banks had more funds available to lend than a year earlier and 16 percent indicated their banks had less. Even so, the District’s average loan-to-deposit ratio softened to 75.7 percent in the third quarter of 2024. The gap between the average loan-to-deposit ratio and the average level desired by the responding bankers narrowed from a year ago to around 5 percentage points, with 58 percent of the survey respondents stating that their respective banks were below their targeted levels.
2. Index of demand for Seventh District non-real-estate farm loans
Credit conditions at Seventh District agricultural banks
| Interest rates on farm loans | |||||||
| Loan demand | Funds availability | Loan repayment rates | Average loan-to-deposit ratio | Operating loansa |
Feeder cattlea |
Real estatea | |
|---|---|---|---|---|---|---|---|
| (index)b | (index)b | (index)b | (percent) | (percent) | (percent) | (percent) | |
| 2023 | |||||||
| Jan–Mar | 78 | 102 | 123 | 70.3 | 7.97 | 7.93 | 7.14 |
| Apr–June | 77 | 83 | 105 | 72.8 | 8.24 | 8.19 | 7.33 |
| July–Sept | 81 | 72 | 100 | 74.3 | 8.50 | 8.47 | 7.70 |
| Oct–Dec | 106 | 69 | 92 | 74.0 | 8.51 | 8.49 | 7.60 |
| 2024 | |||||||
| Jan–Mar | 136 | 78 | 78 | 76.1 | 8.44 | 8.45 | 7.57 |
| Apr–June | 104 | 74 | 85 | 76.9 | 8.47 | 8.44 | 7.55 |
| July–Sept | 120 | 92 | 76 | 75.7 | 8.12 | 8.09 | 7.19 |
Looking forward
Another respondent from Illinois remarked that “lower net farm income and cash flow difficulties will affect land values.” In the third quarter of 2024, 55 percent of survey respondents considered farmland to be overvalued and 45 percent of them considered farmland to be appropriately valued (none viewed farmland as undervalued). A decline was expected for District farmland values in the final quarter of 2024 by 34 percent of survey respondents (2 percent expected them to rise and 64 percent expected them to be stable). In line with these survey results, softer demand for agricultural land will likely extend into 2025: 45 percent and 35 percent of survey respondents expected farmers and nonfarm investors, respectively, to have weaker demand to acquire farmland this fall and winter compared with a year earlier (less than 20 percent expected these groups to have stronger demand). Overall, respondents anticipated a drop in the volume of farmland transfers during this fall and winter relative to a year ago.
Net cash earnings (which include government payments) for crop and livestock farmers were expected to be lower during the fall and winter from their levels of a year earlier, according to the responding bankers. For crop farmers, 3 percent of survey respondents forecasted net cash earnings to rise over the next three to six months relative to a year ago, while 91 percent forecasted these earnings to fall. For dairy farmers, 14 percent of survey respondents expected net cash earnings to increase over the next three to six months relative to a year ago, while 22 percent expected these earnings to decrease. The District’s cattle and hog operations were expected to do roughly the same, with 22 percent of responding bankers forecasting higher net cash earnings for cattle and hog farmers over the next three to six months relative to a year earlier and 31 percent forecasting lower such earnings. The livestock sector faced dim prospects for income growth, but nothing like the slump facing the crop sector.
Forty-two percent of the responding bankers predicted a lower volume of farm loan repayments over the next three to six months compared with a year earlier, while just 1 percent predicted a higher volume. Unsurprisingly, given income expectations, forced sales or liquidations of farm assets owned by financially distressed farmers were anticipated to rise in the next three to six months relative to a year ago, as 38 percent of the responding bankers anticipated them to increase and 2 percent anticipated them to decrease. Non-real-estate loan volumes (specifically for operating loans, feeder cattle loans, and loans guaranteed through the USDA’s Farm Service Agency) were forecasted to be larger in the last three months of 2024 compared with the same three months of 2023. Farm real estate loan volumes were forecasted to be smaller in the last three months of 2024 compared with the same three months of a year earlier. Though dipping farm interest rates could help some, agricultural credit conditions were expected to keep weakening as farm incomes, for the most part, keep shrinking.
Selected agricultural economic indicators
| Percent change from | |||||
|---|---|---|---|---|---|
| Latest period | Value | Prior period | Year ago | Two years ago | |
| Prices received by farmers (index, 2011=100) | September | 121 | –5.6 | –1 | –8 |
| Crops (index, 2011=100) | September | 99 | –1.1 | –13 | –22 |
| Corn ($ per bu.) | September | 3.98 | 3.6 | –24 | –44 |
| Hay ($ per ton) | September | 161.00 | –3.0 | –22 | –35 |
| Soybeans ($ per bu.) | September | 10.20 | –1.0 | –23 | –28 |
| Wheat ($ per bu.) | September | 5.36 | 2.5 | –24 | –39 |
| Livestock and products (index, 2011=100) | September | 146 | –7.5 | 10 | 7 |
| Barrows & gilts ($ per cwt.) | September | 64.00 | –5.7 | –2 | –13 |
| Steers & heifers ($ per cwt.) | September | 185.00 | –3.6 | 1 | 28 |
| Milk ($ per cwt.) | September | 25.50 | 8.1 | 22 | 6 |
| Eggs ($ per doz.) | September | 2.07 | –35.5 | 71 | –22 |
| Consumer prices (index, 1982–84=100) | September | 315 | 0.2 | 2 | 6 |
| Food | September | 332 | 0.4 | 2 | 6 |
| Production or stocks | |||||
| Corn stocks (mil. bu.) | September 1 | 1,760 | N.A. | 29 | 28 |
| Soybean stocks (mil. bu.) | September 1 | 342 | N.A. | 30 | 25 |
| Wheat stocks (mil. bu.) | September 1 | 1,986 | N.A. | 12 | 12 |
| Beef production (bil. lb.) | September | 2.20 | –3.6 | 3 | –8 |
| Pork production (bil. lb.) | September | 2.23 | –2.5 | 2 | –1 |
| Milk production (bil. lb.) | September | 18.2 | –3.8 | 0 | 0 |
| Agricultural exports ($ mil.) | September | 13,130 | 0.9 | 3 | –4 |
| Corn (mil. bu.) | September | 168 | –17.0 | 35 | 63 |
| Soybeans (mil. bu.) | September | 109 | 73.7 | 20 | 40 |
| Wheat (mil. bu.) | September | 90 | 0.6 | 33 | –20 |
| Farm machinery (units) | |||||
| Tractors, 40 HP or more | September | 6,939 | 3.2 | –17 | –17 |
| 40 to 100 HP | September | 4,615 | –0.8 | –13 | –19 |
| 100 HP or more | September | 2,324 | 12.2 | –25 | –11 |
| Combines | September | 530 | –14.4 | –41 | –41 |
The Changing Landscape for Agricultural Inputs
On December 3, 2024, the Federal Reserve Bank of Chicago will hold a hybrid event to evaluate impacts from changes related to agricultural inputs for Midwest farming. Registration is available online.


