

Read our AgLetter Insights Q&A with author David Oppedahl for further insights into Seventh District farmland values and agricultural credit conditions described in this issue of AgLetter.
Summary
An annual decrease of 1 percent in the Seventh Federal Reserve District’s agricultural land values in 2024 ended a four-year run of substantial annual gains. Even so, values for “good” farmland in the District moved up 1 percent in the fourth quarter of 2024 from the third quarter, according to the respondents from 133 agricultural banks who completed the January 1 survey. Only 4 percent of the survey respondents expected farmland values to rise during the January through March period of 2025, while 26 percent expected them to fall (the majority expected them to be stable).
District agricultural credit conditions continued to exhibit signs of deterioration during the fourth quarter of 2024. In the final quarter of 2024, repayment rates for non-real-estate farm loans were sharply lower than a year ago, plus loan renewals and extensions were noticeably higher than a year earlier. Nearly 2 percent of agricultural borrowers were not likely to qualify for operating credit at the survey respondents’ banks in 2025 after qualifying in the previous year. Non-real-estate farm loan demand relative to a year ago was up for the fifth quarter in a row. For the seventh time in a row, there were fewer funds available for lending than in the same quarter of the prior year at survey respondents’ banks. The average loan-to-deposit ratio for the District moved up to 76.7 percent in the fourth quarter of 2024. At the end of 2024, the District’s average nominal interest rates on farm operating and feeder cattle loans were somewhat lower than at the end of the third quarter of last year, while its average nominal interest rate on farm real estate loans was unchanged. Average real interest rates for all three kinds of loans tracked by the survey were at their lowest levels since the third quarter of 2023.
Farmland values
In 2024, the District saw an annual decrease of 1 percent in its agricultural land values (see table and map below). For the first time in five and six years, Illinois and Indiana, respectively, had annual decreases in their farmland values. In addition, Iowa had a slightly larger single-digit annual decrease in its farmland values than in 2023. In contrast, Wisconsin had a single-digit annual increase in agricultural land values for 2024. A Wisconsin banker noted there was “still very little land available for sale.” District farmland values increased 1 percent from the third quarter of 2024 to the fourth quarter.
Percent change in dollar value of “good” farmland
| October 1, 2024 to January 1, 2025 |
January 1, 2024 to January 1, 2025 |
|
|---|---|---|
| Illinois | +1 | –3 |
| Indiana | +1 | –3 |
| Iowa | +1 | –2 |
| Michigan | * | * |
| Wisconsin | +1 | +8 |
| Seventh District | +1 | –1 |
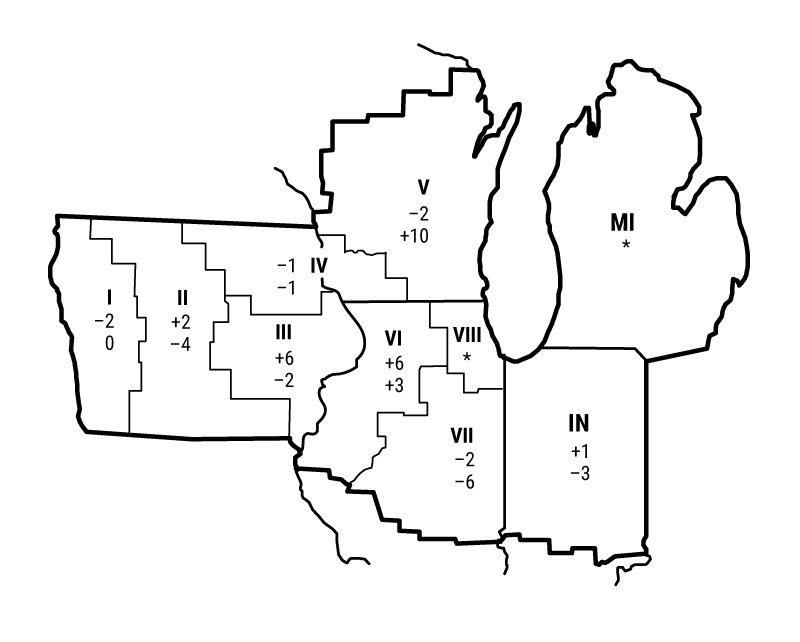
Top: October 1, 2024 to January 1, 2025
Bottom: January 1, 2024 to January 1, 2025
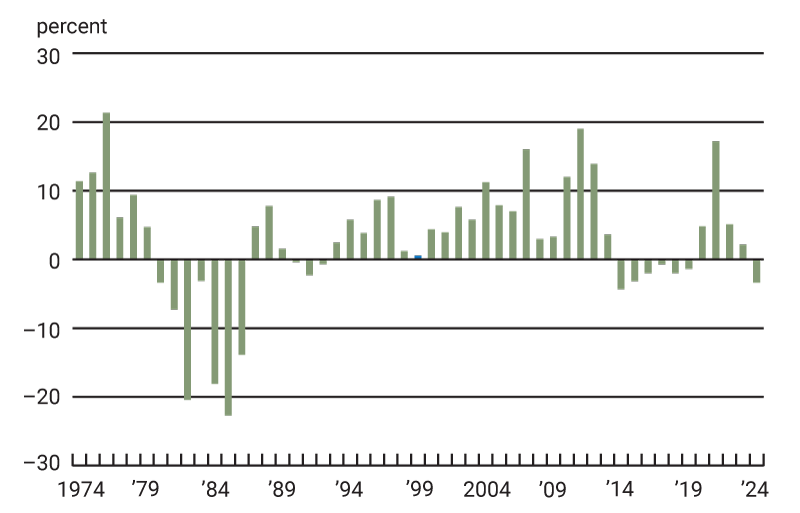
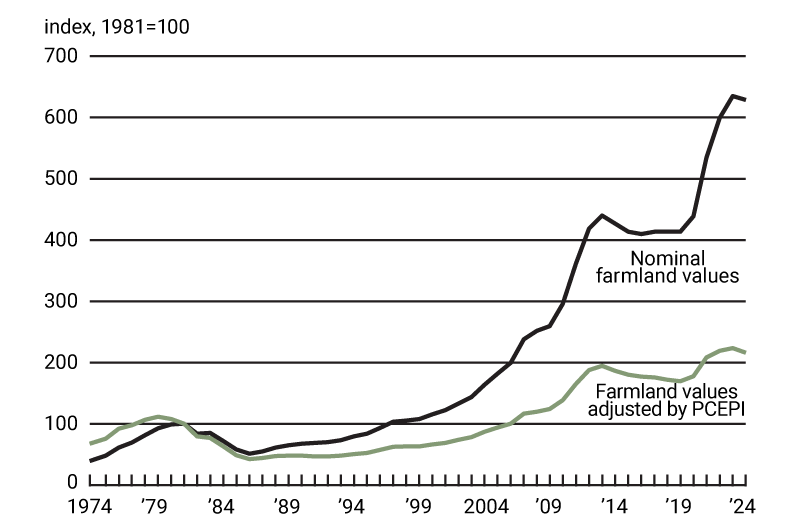
Adjusted for inflation by the Personal Consumption Expenditures Price Index (PCEPI), District farmland values had an annual decrease of 3.4 percent in 2024, the first real decrease in five years and the largest real decrease since 2014 (see chart 1). District farmland values edged down from their 2023 peak, but were still 11 percent above their 2013 peak in real terms and up 43 percent from their 2013 peak in nominal terms (see chart 2).
1. Annual real change in Seventh District farmland values
2. Indexes of Seventh District farmland values
Strong crop yields were a boon for a majority of District farms in 2024, despite drought in much of the District for at least part of the growing season. Based on calculations using U.S. Department of Agriculture (USDA) data, the District states’ corn yields increased 3.7 percent in 2024 from 2023 and their soybean yields increased 1.1 percent. Harvested corn acres were down 3.2 percent in 2024 from 2023, while harvested soybean acres were up 3.5 percent. On net, corn production by District states increased 0.3 percent, reaching 6.80 million bushels (the second most ever, after 2016’s record). In addition, soybean production by District states rose 4.6 percent, to 1.84 million bushels (the second largest ever, behind 2021’s record). National corn stocks decreased 1 percent from 2023, while soybean stocks increased 3 percent (see final table). Although corn stocks declined, the USDA projected prices for the 2024–25 crop year of $4.25 per bushel for corn (down 6.6 percent from the previous crop year). Given the broader availability of soybeans, their prices were projected to be $10.20 per bushel (down 18 percent). Using these prices, estimated revenues for the District states’ 2024 harvest would be down 6.3 percent for corn and 14 percent for soybeans from their 2023 levels.
In contrast, prices for livestock products were much higher at the end of 2024 than at the start of the year. In December 2024, the index of prices for livestock and associated products was up 33 percent from 2023; the prices for cattle, hogs, and milk were up 10 percent, 18 percent, and 14 percent from a year earlier, respectively (see final table). Moreover, given ongoing impacts from avian influenza, egg prices were up 132 percent from the year prior, though these prices were down 4 percent from two years ago. According to the USDA’s February assessment for 2024, net farm income for the nation was projected to decline by 5.6 percent ($8.2 billion) from 2023 despite lower input costs, mostly because of inventory adjustments and lower government payments. The dip in farm cash receipts from 2023 was minor given that the drop in cash receipts for crops was almost entirely offset by an increase in cash receipts for animals and their products. Nationally, 2024 real net farm income, though down from 2023, remained above its 2020 level. The District’s heavier reliance on corn and soybean revenues created tighter profit margins for lots of farms in the region.
Credit conditions
A deterioration in agricultural credit conditions was evident in the fourth quarter of 2024 as several respondents reported declines in working capital for farm operations. An Illinois respondent noted: “Working capital levels have declined significantly the last two years. In addition, projected 2025 cash flows are very tight.” During the fourth quarter of 2024, demand for non-real-estate farm loans was higher than a year ago: With 44 percent of survey respondents reporting an increase in the demand for non-real-estate farm loans from a year earlier and 15 percent reporting a decrease, the index of loan demand was 129 in the fourth quarter of 2024. The index of funds availability was 90 in the fourth quarter of 2024, indicating a continuing decline in the level of funds available for lending from a year ago; funds availability was lower than a year earlier at 19 percent of the survey respondents’ banks and higher at just 9 percent. At 76.7 percent in the fourth quarter of 2024, the District’s average loan-to-deposit ratio was slightly higher than that of the previous quarter (and over 4 percentage points lower than the level desired by responding bankers).
The share of the District’s farm loan portfolio assessed as having “major” or “severe” repayment problems was 4.3 percent in the fourth quarter of 2024—the highest it’s been since the end of 2020. Non-real-estate loan repayment rates relative to a year ago were down for the fifth consecutive quarter. The index of non-real-estate farm loan repayments was 64, with 36 percent of survey respondents reporting lower rates for the fourth quarter of 2024 than a year earlier and zero respondents reporting higher rates. Non-real-estate farm loan renewals and extensions in the final quarter of 2024 were higher than in the final quarter of 2023, as 31 percent of survey respondents reported more of them and 1 percent reported fewer.
Up from the previous year’s reading, 40 percent of survey respondents’ banks tightened their credit standards for farm loans in the fourth quarter of 2024 compared with a year earlier, while 60 percent of the respondents’ banks kept their credit standards essentially unchanged. However, 81 percent of responding bankers noted their banks did not raise the amounts of collateral required for customers to qualify for non-real-estate farm loans during the final quarter of 2024 relative to a year ago, while 19 percent noted their banks required larger amounts.
Agricultural interest rates in nominal terms (except for farm real estate loans) fell slightly from the third quarter of 2024 to the fourth quarter. As of January 1, 2025, the District’s average nominal interest rates for new loans were 7.78 percent on operating loans, 7.88 percent on feeder cattle loans, and 7.19 percent on farm real estate loans; in real terms (after being adjusted for inflation with the PCEPI), the average interest rates for all three types of agricultural loans were at their lowest levels since the third quarter of 2023.
Credit conditions at Seventh District agricultural banks
| Interest rates on farm loans | |||||||
| Loan demand | Funds availability | Loan repayment rates | Average loan-to-deposit ratio | Operating loansa |
Feeder cattlea |
Real estatea | |
|---|---|---|---|---|---|---|---|
| (index)b | (index)b | (index)b | (percent) | (percent) | (percent) | (percent) | |
| 2023 | |||||||
| Jan–Mar | 78 | 102 | 123 | 70.3 | 7.97 | 7.93 | 7.14 |
| Apr–June | 77 | 83 | 105 | 72.8 | 8.24 | 8.19 | 7.33 |
| July–Sept | 81 | 72 | 100 | 74.3 | 8.50 | 8.47 | 7.70 |
| Oct–Dec | 106 | 69 | 92 | 74.0 | 8.51 | 8.49 | 7.60 |
| 2024 | |||||||
| Jan–Mar | 136 | 78 | 78 | 76.1 | 8.44 | 8.45 | 7.57 |
| Apr–June | 104 | 74 | 85 | 76.9 | 8.47 | 8.44 | 7.55 |
| July–Sept | 120 | 92 | 76 | 75.7 | 8.12 | 8.09 | 7.19 |
| Oct–Dec | 129 | 90 | 64 | 76.7 | 7.78 | 7.88 | 7.19 |
Looking forward
According to survey respondents at the beginning of 2025, 1.7 percent of their farm customers with operating credit in the year just past were not likely to qualify for new operating credit in the year ahead (somewhat above the survey’s level at the start of 2024). Farm real estate loan volumes were forecasted to be smaller in the first three months of 2025 compared with the same three months of 2024. Nevertheless, non-real-estate loan volumes (specifically for operating loans, feeder cattle loans, and loans guaranteed through the USDA’s Farm Service Agency) were forecasted to be larger in the first three months of 2025 compared with the same three months of a year earlier. Over this time frame, lending for farm machinery and grain storage construction was expected to decline relative to a year ago. Plus, survey respondents at the start of 2025 predicted capital expenditures by farmers would once again be lower in the year ahead than in the year just ended for land purchases or improvements, buildings and facilities, machinery and equipment, and trucks and autos.
There were fewer responding bankers (4 percent) who projected agricultural land values to go up in the next quarter (in this case, the first quarter of 2025) than those who predicted them to go down (26 percent). With that said, there seemed to be some transactions for farmland in places at much higher prices than for similar ground elsewhere; an Illinois respondent attributed this phenomenon to “strong competition among neighbors buying with cash on hand.” Thus, there will likely be marked variability in sales prices for specific parcels. But again, on average, District farmland values were expected to be relatively flat or moving slightly downward in the first quarter of 2025, as they had been prior to the pandemic.
Selected agricultural economic indicators
| Percent change from | |||||
|---|---|---|---|---|---|
| Latest period | Value | Prior period | Year ago | Two years ago | |
| Prices received by farmers (index, 2011=100) | December | 127 | 5.3 | 12 | –8 |
| Crops (index, 2011=100) | December | 93 | –1.8 | –9 | –28 |
| Corn ($ per bu.) | December | 4.23 | 3.9 | –12 | –36 |
| Hay ($ per ton) | December | 157.00 | –1.3 | –19 | –33 |
| Soybeans ($ per bu.) | December | 9.79 | –0.5 | –25 | –32 |
| Wheat ($ per bu.) | December | 5.49 | 0.7 | –19 | –39 |
| Livestock and products (index, 2011=100) | December | 172 | 8.3 | 33 | 14 |
| Barrows & gilts ($ per cwt.) | December | 62.90 | –3.7 | 18 | 0 |
| Steers & heifers ($ per cwt.) | December | 193.00 | 1.6 | 10 | 22 |
| Milk ($ per cwt.) | December | 23.30 | –3.7 | 14 | –5 |
| Eggs ($ per doz.) | December | 4.33 | 37.9 | 132 | –4 |
| Consumer prices (index, 1982–84=100) | December | 316 | 0.0 | 3 | 6 |
| Food | December | 334 | 0.2 | 3 | 5 |
| Production or stocks | |||||
| Corn stocks (mil. bu.) | December 1 | 12,074 | N.A. | –1 | 12 |
| Soybean stocks (mil. bu.) | December 1 | 3,100 | N.A. | 3 | 3 |
| Wheat stocks (mil. bu.) | December 1 | 1,570 | N.A. | 10 | 20 |
| Beef production (bil. lb.) | December | 2.20 | –0.7 | 0 | –1 |
| Pork production (bil. lb.) | December | 2.33 | –0.2 | –1 | 4 |
| Milk production (bil. lb.) | December | 18.7 | 4.2 | 0 | –1 |
| Agricultural exports ($ mil.) | December | 16,150 | –7.1 | 4 | –5 |
| Corn (mil. bu.) | December | 214 | 15.8 | 13 | 47 |
| Soybeans (mil. bu.) | December | 293 | –19.4 | 65 | –4 |
| Wheat (mil. bu.) | December | 61 | 16.7 | 10 | 53 |
| Farm machinery (units) | |||||
| Tractors, 40 HP or more | December | 7,727 | 95 | –15 | –20 |
| 40 to 100 HP | December | 5,276 | 75 | –9 | –17 |
| 100 HP or more | December | 2,451 | 157 | –27 | –25 |
| Combines | December | 444 | 206 | –26 | –39 |


