Job growth in the Seventh District in 2016—A post-benchmarking update
Here at the Chicago Fed, we closely track one of the most important regional economic indicators, the U.S. Bureau of Labor Statistics’ (BLS) payroll employment survey (also known as the Current Employment Statistics, or CES). The survey is important because it provides a good picture of the overall state of an economy and its initial results are released quickly (unlike some other regional data that are released with a lag of a month or more). Unfortunately, the relatively quick turnaround also means we must exercise caution. While we get an initial estimate only three weeks after the end of the reference month, the estimate can sometimes be revised substantially later on. The BLS makes minor revisions to the data one month after the initial release and major revisions once a year, when the survey is benchmarked to the unemployment insurance census (released as the Quarterly Census of Employment and Wages, or QCEW).1
The BLS recently released newly benchmarked data, so we now have an update on how well the Seventh Federal Reserve District2 did in 2016. Table 1 shows that, for the most part, the job growth numbers that the BLS had been reporting before the most recent benchmarking held true. Overall, Seventh District employment grew at a pace of about 1 percent in 2016, with the BLS reporting a 0.9% increase before benchmarking and a 1.1% increase after. In addition, the most recent benchmarking further affirmed the division in performance between the eastern and western parts of the District over the past few years. Job growth for Indiana and Michigan in 2016 was revised up, whereas job growth for Illinois, Iowa, and Wisconsin was revised down. So now, the job growth numbers for Michigan and Indiana in 2016 easily exceeded the numbers for Illinois, Iowa, and to a lesser extent, Wisconsin.
Table 1. Nonfarm job growth in the Seventh District in 2016
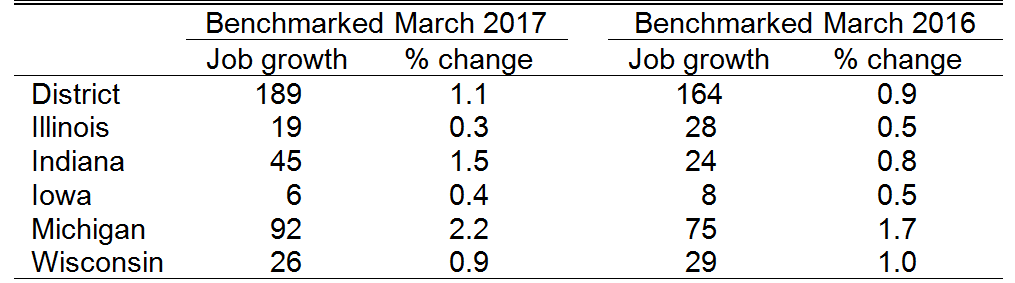
Sources: Author's calculations based on data from the U.S. Bureau of Labor Statistics, Current Employment Statistics (CES) and Quarterly Census of Employment and Wages (QCEW), from Haver Analytics.
The most recent benchmarking by the BLS also gives us the opportunity to see how well we did at predicting the benchmark revisions using a method known as “early benchmarking.”3 The main idea behind early benchmarking is that it’s possible to use the QCEW data, which are released quarterly, to predict the major annual revisions to the job growth numbers.
This year we found that, unlike last year, the early benchmarked estimates (which we produced in January 2017) were further from the newly released job growth numbers than the March 2016 benchmarked CES estimates were. Our only consolation is that the early benchmarked estimates did get closer to the newly released numbers for the first half of 2016. I’ll explain what happened a little later.
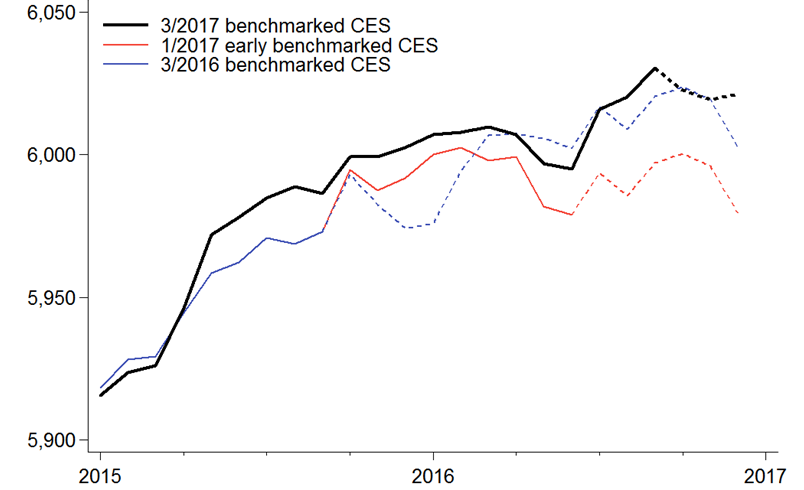
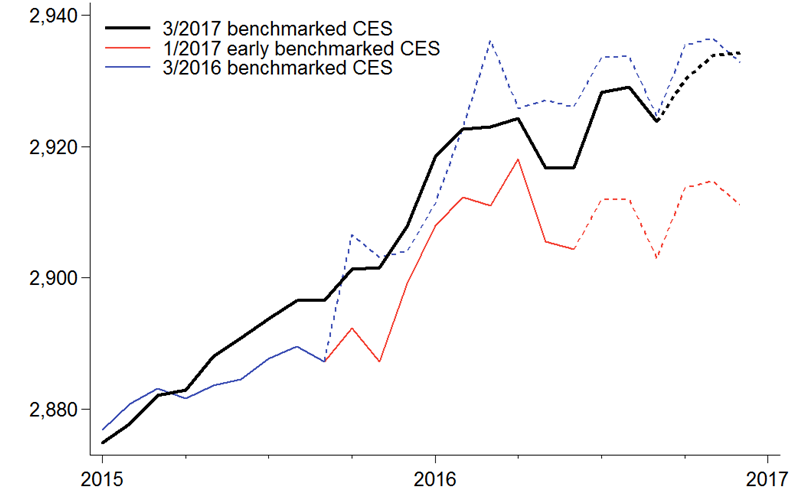
Let’s look first at how the early benchmarking procedure did for the District as a whole. Figure 1 shows three versions of the Seventh District’s CES data, where the solid portion of a line represents data that have been benchmarked using the QCEW and the dashed portion represents data that have not.4 The black line is the version released in March 2017 (with benchmarked data through September 2016), the red line is the early benchmarked version that we calculated in January 2017 (with benchmarked data through June 2016), and the blue line is the version released in March 2016 (with benchmarked data through September 2015). Surprisingly, in spite of nine months of additional benchmarked data, the March 2016 benchmarked CES appears to track the newly released data better than the early benchmarked CES.
Figure 1. Seventh District employment (thousands)
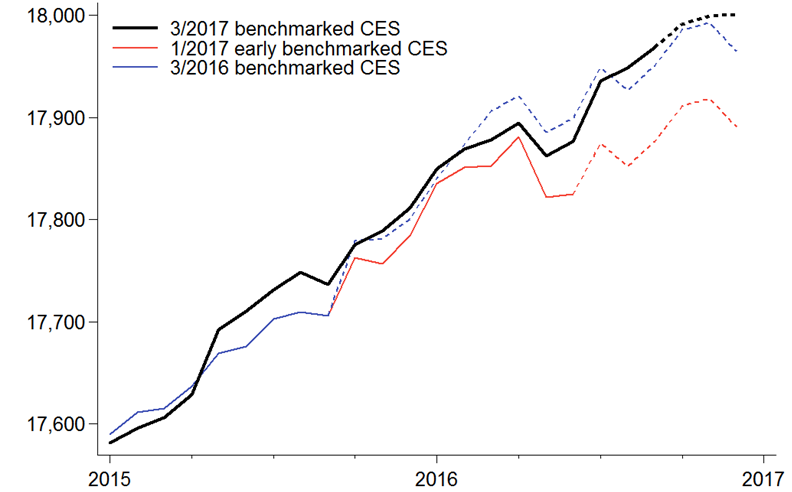
Sources: Author's calculations based on data from the U.S. Bureau of Labor Statistics, Current Employment Statistics (CES) and Quarterly Census of Employment and Wages (QCEW), from Haver Analytics.
The first row of table 2 summarizes figure 1 in terms of December-to-December job growth for 2016. For this period, the early benchmarking method performed notably worse: It underestimated District job growth by 83,000, while the March 2016 benchmarked data underestimated job growth by only 25,000. The remaining rows of table 2 summarize 2016 job growth for District states (figures plotting the data for District states are at the end of the post). This year, Indiana was the only state for which the early benchmarked growth estimates had a smaller error than the March 2016 benchmarked data, though the errors for Michigan were very close. The early benchmarking method did particularly poorly for Illinois, estimating that employment fell by 13,000 for the year when it actually grew by 19,000.
Table 2. Nonfarm job growth in the Seventh District in 2016
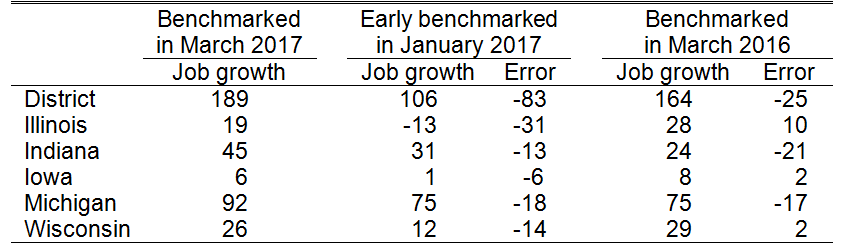
Sources: Author's calculations based on data from the U.S. Bureau of Labor Statistics, Current Employment Statistics (CES) and Quarterly Census of Employment and Wages (QCEW), from Haver Analytics.
The poor performance of the early benchmarking method was surprising. We expected the early benchmarking method to do better for the first half of 2016 because it could take full advantage of the available QCEW data. And for the second half of the year, we knew by definition that the method would perform the same as the March 2016 benchmarked data because it used that version’s growth numbers. So, given these half-year results, how could the early benchmarking method do worse for the full year? Table 3 shows how. The early benchmarking method’s errors were negative in both halves of the year, while the errors of the March 2016 benchmarked CES were positive in the first half and negative in the second half. So the early benchmarking method’s errors built on each other, whereas the errors in the March 2016 benchmarked data cancelled each other out.
Table 3. Errors by first and second halves of 2016 (thousands)
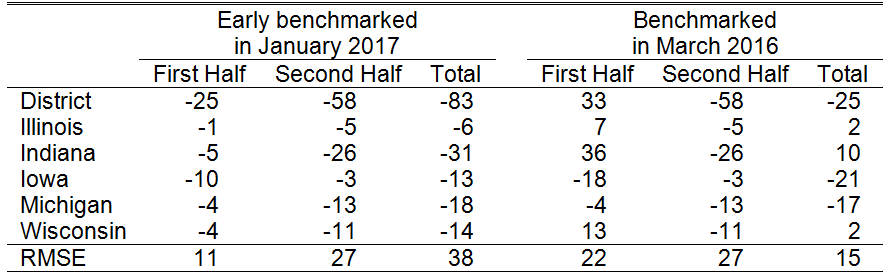
Sources: Author's calculations based on data from the U.S. Bureau of Labor Statistics, Current Employment Statistics (CES) and Quarterly Census of Employment and Wages (QCEW), from Haver Analytics.
Even though the early benchmarking method did not do well this year, we still think it is a useful tool for predicting benchmark revisions because it can take full advantage of the available QCEW data. We will see what happens in 2018.
Figure 2. Illinois employment (thousands)
Sources: Author's calculations based on data from the U.S. Bureau of Labor Statistics, Current Employment Statistics (CES) and Quarterly Census of Employment and Wages (QCEW), from Haver Analytics.
Figure 3. Indiana employment (thousands)
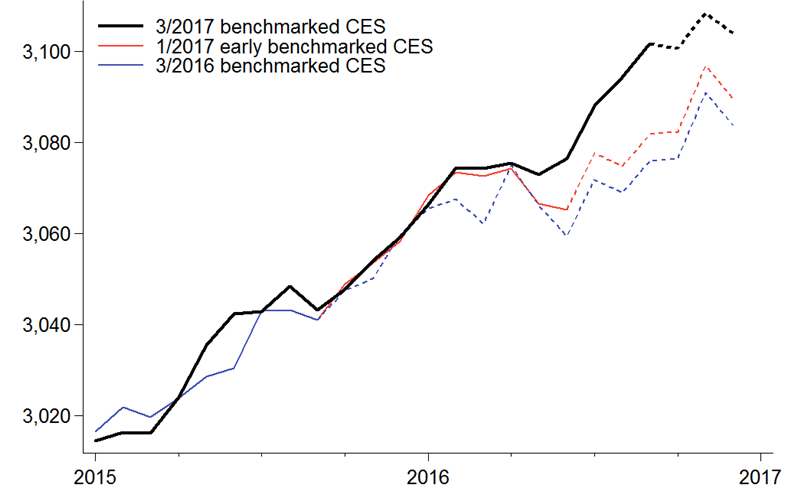
Sources: Author's calculations based on data from the U.S. Bureau of Labor Statistics, Current Employment Statistics (CES) and Quarterly Census of Employment and Wages (QCEW), from Haver Analytics.
Figure 4. Iowa employment (thousands)
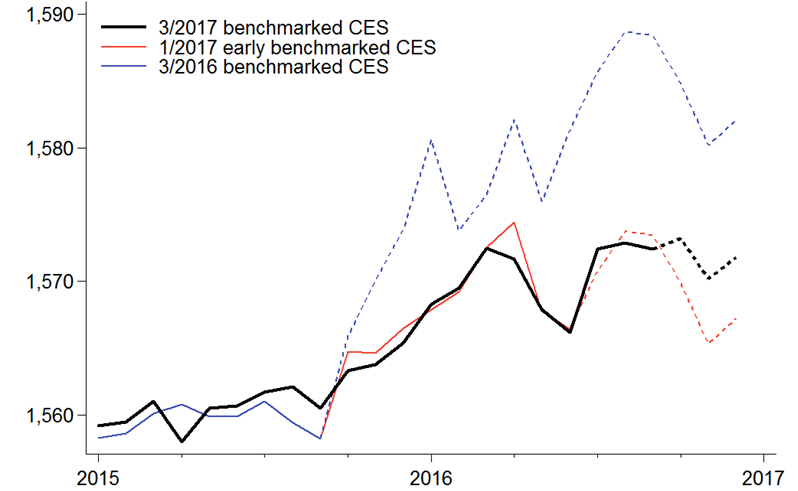
Sources: Author's calculations based on data from the U.S. Bureau of Labor Statistics, Current Employment Statistics (CES) and Quarterly Census of Employment and Wages (QCEW), from Haver Analytics.
Figure 5. Michigan employment (thousands)
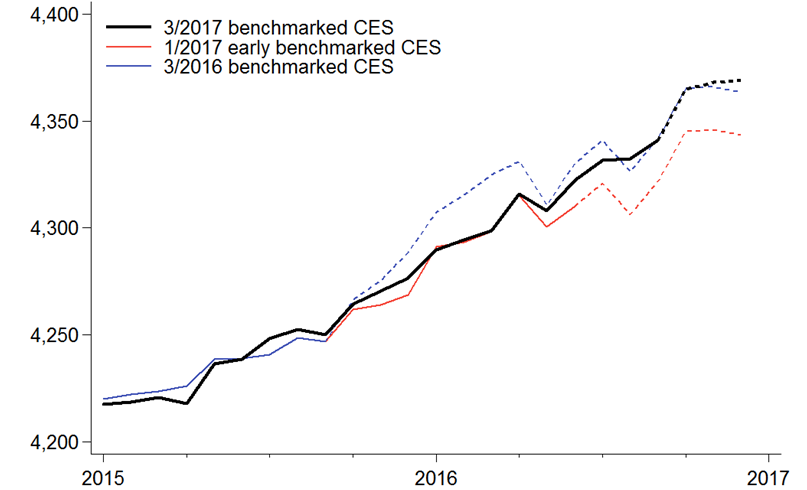
Sources: Author's calculations based on data from the U.S. Bureau of Labor Statistics, Current Employment Statistics (CES) and Quarterly Census of Employment and Wages (QCEW), from Haver Analytics.
Figure 6. Wisconsin employment (thousands)
Sources: Author's calculations based on data from the U.S. Bureau of Labor Statistics, Current Employment Statistics (CES) and Quarterly Census of Employment and Wages (QCEW), from Haver Analytics.
Footnotes
1 For more information on the BLS’s benchmarking process, go here.
2 The Seventh District, which is served by the Chicago Fed, comprises all of Iowa and most of Illinois, Indiana, Michigan, and Wisconsin.
3 An earlier post discussing the method in detail is here.
4 As is clear in figure 1, the BLS also revises already benchmarked data, though the revisions are typically small.


