

In this article, we take a closer look at the implications of rising Covid-19 cases and vaccination rates for the U.S. hourly labor market. To do so, we rely on geographic variation in the high-frequency data collected by the firm Homebase with its timekeeping software. This data source allows us to make use of U.S. state-level variation on a daily basis in order to decompose the effects on hourly employees and hours worked from both rising cases and vaccinations.
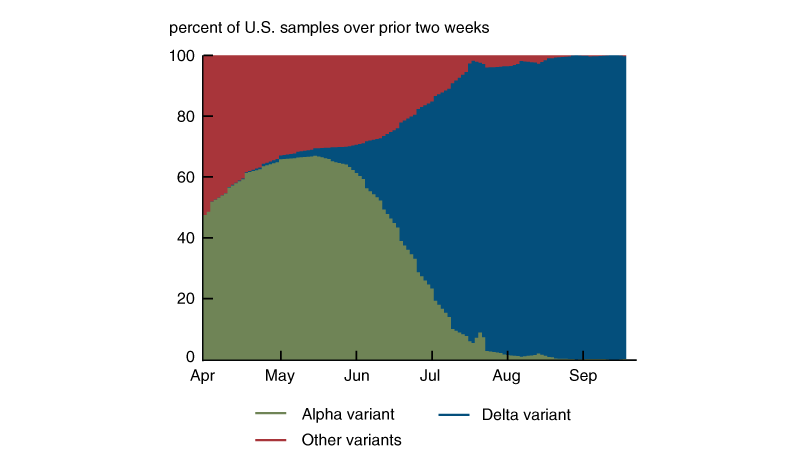
Covid-19 cases have been generally rising in the U.S. since July 2021, after leveling off or falling for a while earlier in the year. This resurgence in cases took place concurrently with the rise of the highly contagious Delta variant of Covid-19, which is now the dominant strain of the virus (over the Alpha variant) in the U.S. (see figure 1). At the same time, vaccination rates across the nation have continued to move up, although their rates of increase have slowed since the initial jump in the spring.
1. The rise of the Covid-19 Delta variant in the U.S., 2021
In this Chicago Fed Letter, we use high-frequency data from Homebase to quantify the impact of the Covid-19 Delta wave on hourly employment. We find that through late September 2021, the positive impacts of rising vaccination rates were sufficient to offset the negative impacts of the recent resurgence in the virus.
Homebase data and the leisure and hospitality sectors
Throughout the pandemic, the hourly employment data from Homebase have proven to be a reliable source for measuring the real-time impact of Covid-19 on the leisure and hospitality sectors. Despite representing only about 10% of nonfarm payrolls, the leisure and hospitality sectors have been front and center during this time: Payroll changes in these two sectors account for very large percentages of the decline in jobs during the 2020 recession, as well as the increase in jobs during the subsequent recovery.
Before the Delta wave of the virus, movements in the Homebase data correlated strongly with those in leisure and hospitality payrolls. For example, the rate of growth (relative to April 2021) in hourly employees in the Homebase data tracked quite closely with growth in leisure and hospitality payrolls (also relative to April 2021) from mid-April through early July of 2021 (see figure 2).1 However, from its peak in July through late September, hourly employees in the Homebase data have declined by about 10 percentage points, whereas leisure and hospitality payrolls were unchanged from July to August.
2. Hourly employees and leisure and hospitality payrolls, 2021
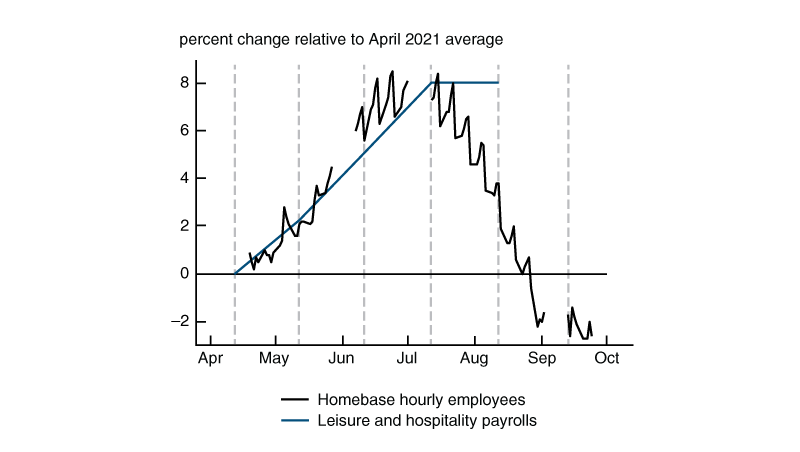
Sources: Homebase from Haver Analytics; and authors’ calculations based on data from the U.S. Bureau of Labor Statistics, Current Employment Statistics (CES) survey, from Haver Analytics.
Given the timing of the survey underlying the leisure and hospitality payroll data (noted in figure 2 by the dashed vertical lines), we may not see the full effect of the recent declines in the Homebase data until the September payroll survey results are released on October 8, 2021.2 Even so, there are some important caveats to keep in mind. First, unlike the broader payroll survey, the Homebase data are limited to only hourly workers; and second, these are primarily workers employed by small, individually owned or operator-managed retail, restaurant, and personal service businesses.3
For these reasons, translating movements in Homebase hourly employees directly to leisure and hospitality payrolls likely overstates their representation of the labor force. Still, we can use the relationship in figure 2 to provide an estimate of the impact of the Delta wave on hourly employment.4 We estimate that the rate of change in Homebase hourly employees between its peak in early July and late September translates to about 200,000 fewer hourly jobs in the leisure and hospitality sectors during this three-month period (see note 4 for details). This gives us a starting point for discussing the effects of the resurgence in the virus, as well as changes in vaccination rates, on the hourly labor market.
Homebase data and Covid-19 cases and vaccinations
In order to more formally capture the relationship between the Homebase data and the Delta wave of the virus, we decompose the variation over time in the state-level Homebase data on hourly employees and hours worked using panel regression analysis.5 Specifically, we regress the percent changes in the Homebase data since April 2021 on a daily basis on the growth in Covid-19 cases and changes in the share of fully vaccinated persons since April.6 The use of state-level, as opposed to national, data allows for us to flexibly capture regional differences in virus transmission and vaccine take-up in our panel regression with coefficients that vary by U.S. Census division.7
Also included in these regressions are state fixed effects interacted with percent changes in the number of open businesses in the Homebase data since April 2021 and a linear time trend. Together these variables help to control for sample attrition,8 as well as seasonality in the number of open businesses that may vary by state. To further address seasonality, we also exclude from the sample of weekdays those observations from the Friday before a federal holiday up until the Friday after that holiday.
In order to ensure that our results are nationally representative of the hourly labor market, we exploit the connection that we demonstrated in figure 2 and weight our panel regressions by each state’s share of first quarter 2021 leisure and hospitality payrolls.9 Weighted in this way, our panel regressions reveal that for every Census division, hourly employees and hours worked are positively correlated with changes in the share of fully vaccinated persons since April and negatively correlated with the rate of growth in Covid-19 cases since April. As seen in figure 3, their magnitudes differ, however, with some Census divisions showing larger regression coefficients than others.
3. Regression model coefficients, by Census division
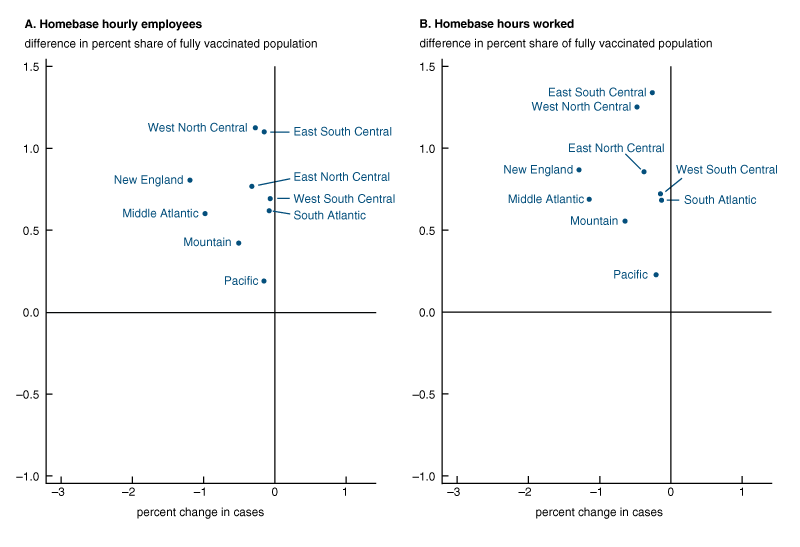
Sources: Authors’ calculations based on data from Homebase, U.S. Bureau of Labor Statistics, U.S. Department of Health and Human Services, and Oxford University, all from Haver Analytics.
Decomposing variation in hourly employees and hours worked
Next, we decompose our regression models’ estimates for national Homebase hourly employees and hours worked into separate parts explained by the changes in Covid-19 cases, vaccination rates, and other factors. Shown in figure 4, this decomposition demonstrates that both hourly employees and hours worked (black lines) continued to benefit from rising vaccination rates (red bars), although the boost has waned over time. In contrast, rising Covid-19 caseloads (green bars) were a drag on growth in these employment variables during this period, with their impact increasing steadily over time.
4. Decomposing the impact of the Delta wave on the hourly labor market, 2021
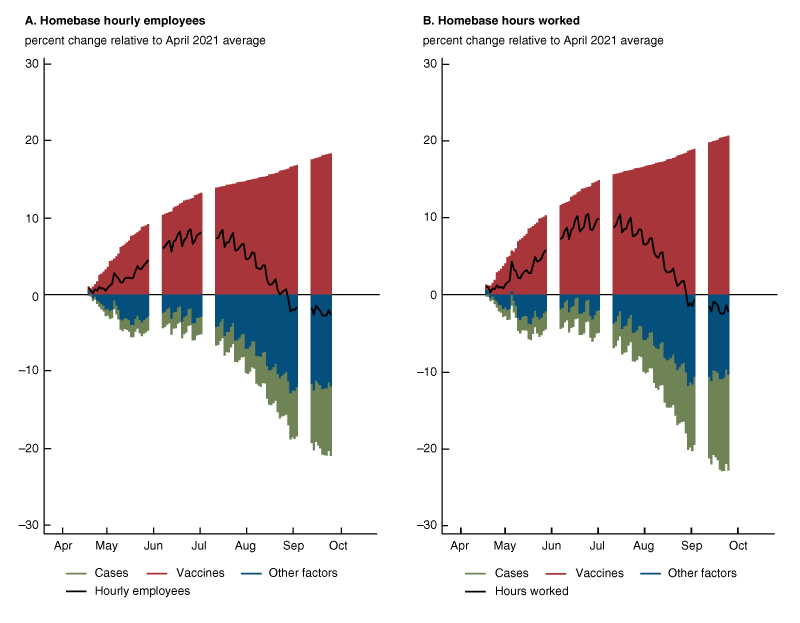
Sources: Authors’ calculations based on data from Homebase, U.S. Bureau of Labor Statistics, U.S. Department of Health and Human Services, and Oxford University, all from Haver Analytics.
We find that the positive effects on hourly employment from increasing vaccinations continued to outweigh the negative ones from rising Covid-19 cases (the sum of the red and green bars) through late September 2021. Using projections for Covid-19 caseloads and vaccinations,10 we forecast with our regressions the combined effects of Covid-19 cases and vaccinations on both hourly employees and hours worked through January 1, 2022. These forecasts are shown in figure 5.
5. Forecasting the combined impact of Covid-19 cases and vaccinations on the hourly labor market
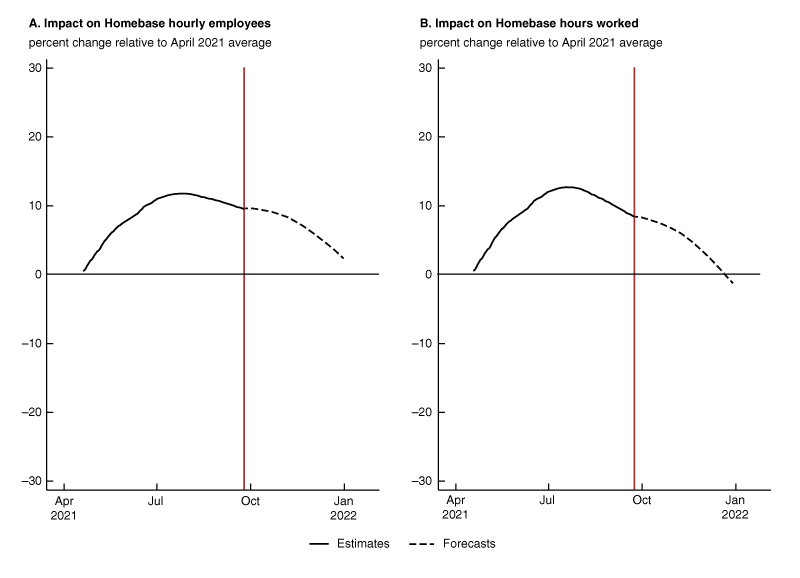
Sources: Authors’ calculations based on data from Haver Analytics, Centers for Disease Control and Prevention (CDC), and Institute for Health Metrics and Evaluation (IHME).
We focus on the forecasts for hourly employees given how similar they are to the forecasts for hours worked. Between its peak in early July and late September 2021, the combined impact of Covid-19 cases and vaccinations on hourly employees declined by about 2.5 percentage points according to our regression model. This decline represents about one-fourth of the fall in hourly employees during this time (shown in figure 2). Translating this percent change to hourly leisure and hospitality jobs as we did before, we get about 50,000 fewer jobs. When projections for Covid-19 caseloads and vaccinations are accounted for, the roughly 10 percentage point decline in employees shown in figure 5 between early July 2021 and early January 2022 corresponds to about 200,000 fewer hourly leisure and hospitality jobs. This would represent about 40% of the decline in overall leisure and hospitality payrolls during the Alpha wave in December 2020/January 2021, before the widespread availability of Covid-19 vaccines in the U.S.
Conclusion
Our analysis of the Homebase data revealed that the beneficial effects of vaccination on the U.S. hourly labor market remain strong, but it also showed that the recent rise in confirmed Covid-19 cases has eroded some of them away. If current projections for Covid-19 transmission and vaccination hold, this is expected to continue as we head into the winter months. It is worth noting, though, that the projections are rapidly evolving and remain highly uncertain. For this reason, we caution against putting too much emphasis on the exact numbers and timing shown in figure 5. That said, our results do suggest that we may be entering a new stage of the pandemic where the initial benefits of the Covid-19 vaccines on hourly employment are perhaps beginning to plateau.
Notes
1 Homebase benchmarks its data to an average value for a reference month, which in the case of figure 2 is April 2021. This means that we can assess changes over time relative to the reference month, but we do not know the actual levels of total hourly employees and hours worked. The data are also not seasonally adjusted. We partially account for this fact in figure 2 by removing observations in Homebase hourly employees from the Friday before a federal holiday up until the Friday after the holiday.2 The payroll data come from the U.S. Bureau of Labor Statistics’ (BLS) Current Employment Statistics survey, also known as the establishment or payroll survey.
3 Of these types of businesses, only restaurants are considered part of the leisure and hospitality sectors. Additional discussion of the Homebase data can be found in an article forthcoming in Business Horizons.4 Homebase covers about 100,000 small businesses (according to the firm’s website). However, not all of these businesses operate in the leisure and hospitality sectors. Kurmann, Lalé, and Ta (2021) estimate that Homebase hourly employees in the leisure and hospitality sectors represented about 20% of all leisure and hospitality workers in February 2020. Taking into account that these workers represented about 70% of total hourly employees in Homebase in February 2020, we obtain our estimate of the impact on hourly leisure and hospitality jobs according to the following: (Leisure and hospitality payrolls in July 2021 × 0.2) × (Rate of change in Homebase hourly employees over the July through September period of 2021 × 0.7).
5 Regressions are statistical exercises that estimate the degree of independent correlation between variables. In our case, each of the Homebase employment data series (hourly employees and hours worked) is the dependent variable (the outcome we are trying to explain) and the Covid-19 case and vaccination data are the independent variables (the factors we think can be used to explain the dependent variable). Through regression analysis, we come up with regression coefficients, which represent the mean change in the dependent variable for one unit of change in an independent variable while holding constant the other independent variables in the analysis that may affect the dependent variable.6 To match the construction of the Homebase data, we measure both Covid-19 cases and vaccinations relative to their April 2021 average based on daily data from April 3 through April 30.
7 The use of state-level data in this way is a notable feature of our earlier work assessing the impact of Covid-19 vaccinations on leisure and hospitality payrolls; see our July 2021 Chicago Fed Insights blog post.8 Additional details on firm exit from the Homebase data can be found in a recent working paper in the Finance and Economics Discussion Series (FEDS) of the Board of Governors of the Federal Reserve System.
9 We use the Quarterly Census of Employment and Wages (QCEW) instead of the CES survey for this purpose because the BLS uses the former to benchmark the state payroll data. This benchmarking, however, occurs only once a year in March given lags in the availability of the QCEW. For further details on this process, see the following article published in the International Journal of Forecasting.10 We use publicly available ensemble forecasts from the Centers for Disease Control and Prevention (as of September 29, 2021) and projections from the Institute for Health Metrics and Evaluation (as of October 1, 2021).


