

The following publication has been lightly reedited for spelling, grammar, and style to provide better searchability and an improved reading experience. No substantive changes impacting the data, analysis, or conclusions have been made. A PDF of the originally published version is available here.
The issue of inflation dogs economic policy. Pro-growth policies generate inflation and that damages the economy in the long run; but anti-inflation policies are anti-growth. Thus, policymakers face an unforgiving Catch-22, recently made worse, some say, by a new “menace,” an inexorable economic juggernaut called services.
Services are immune to the normal logic of economics, the story goes. They continue to grow no matter what happens and have an insatiable appetite for labor. Worst of all, services prices continually increase in good times and bad, creating an unstoppable wellspring of inflation. Of such things are policymakers’ nightmares made.
It is easy to see the origins of this story. Inflation began to heat up a bit in the late 1980s, and monetary policy was adjusted to push it back down. The goods side of the economy responded right on cue. Figure 1 shows the year-over-year growth in the Producer Price Index, less food and energy, by stage of production. With a clarity rare in economics, this graph shows the slowdown’s steady progress through the goods sector pipeline. Crude goods inflation—the most sensitive—began to move downward in early 1988 and is now actually in deflation. Intermediate goods inflation followed suit in late 1988 and is now essentially zero. Final goods inflation is now in the process of slowing.
1. Manufacturing prices come down, step by step

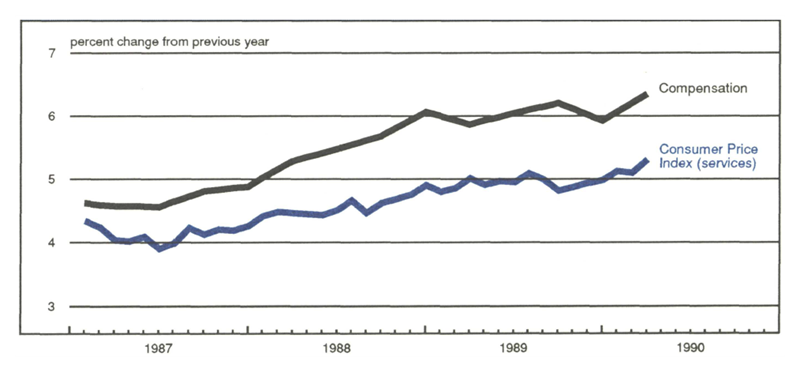
But the service sector just keeps marching on. Whether you look at services inflation or services wages, there is no sign that the current slowdown is having any effect at all, as figure 2 shows. The wage picture seems especially worrisome. Services have a miserable record of productivity growth so that there is little immediate hope that these wage pressures can be offset by productivity enhancement. Thus, the escalating services wages may imply even worse things to come in services inflation. With trends such as these, it is easy to see why some analysts wonder if anything can be done to reverse the current trends in services inflation, short of a dramatic wrenching of the economy.
2. Service costs still up
But reality is less clear
This big picture, however, misses much of the reality of the current situation. Services and other related categories are not as independent of macroeconomic forces as the aggregate numbers would indicate. Two factors have obscured this in the 1980s. First, timing, as was once said of a famous basketball player, “It wasn’t so much that he disobeyed the law of gravity, he was just a bit slow in obeying it.” Services simply tend to respond slowly. Second, rapid growth in some specific industries have distorted the aggregate numbers.
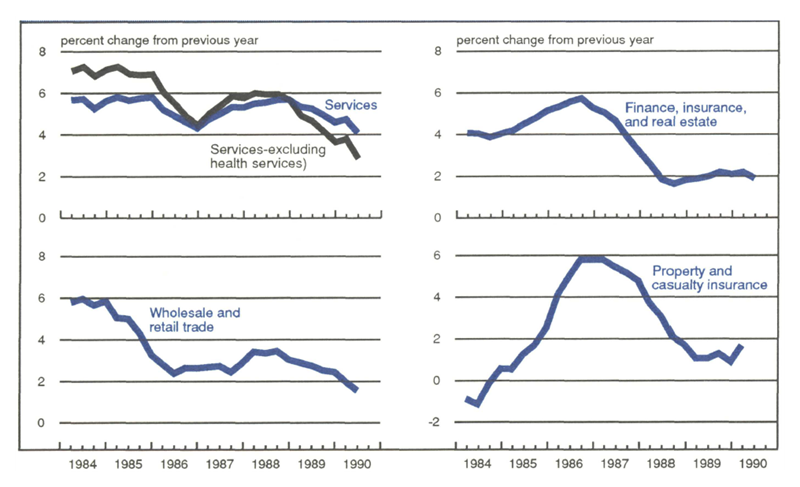
Figure 3 shows a breakdown of recent trends in employment in specific services industries and related areas. The signs of slowdown are unmistakable. Finance, insurance, and real estate are clearly showing the strains of a slower economy. Restaurants and department stores have been cutting back their growth for some time. The cutbacks in the banking and brokerage industries—not to mention S&Ls—have been widely reported. Even taken as a whole, services growth has slowed noticeably in the last year.
Services do feel the pinch of recent events. In the go-go days of financial services and real estate, services seemed untouchable. For not only did these industries grow rapidly, they fed on each other and pulled other services such as legal services and restaurants along. But junk bond problems, the thrift debacle, problems in real estate in the Northeast, and the market crash have all combined to bring services back to reality.
Services wages head skyward?
But if services are slowing, then the question remains: Why are there continued pressures on the wage and price side? Part of the answer, once again, is that changes take time to work their way through the economy. And wages, especially, adjust very slowly to new circumstances. This resistance to change was part of the reason that the adjustments in manufacturing in the early 1980s were so wrenching. And while manufacturing firms and their employees learned greater flexibility during those hard years, the service industry was spared much of the hardship—and the learning.
3. Service employment is dropping
But, in fact, services wage pressures have fallen. It is just that two subsectors are pushing the average up—health services and state and local government. Careful analysis of the Employment Cost Survey indicates that if health care and education could be separated from the rest of services, the wage story would be much better. Unfortunately, the numbers are not collected in a way that allow this. Nevertheless, insight can be gained by looking at some of the detailed statistical series.
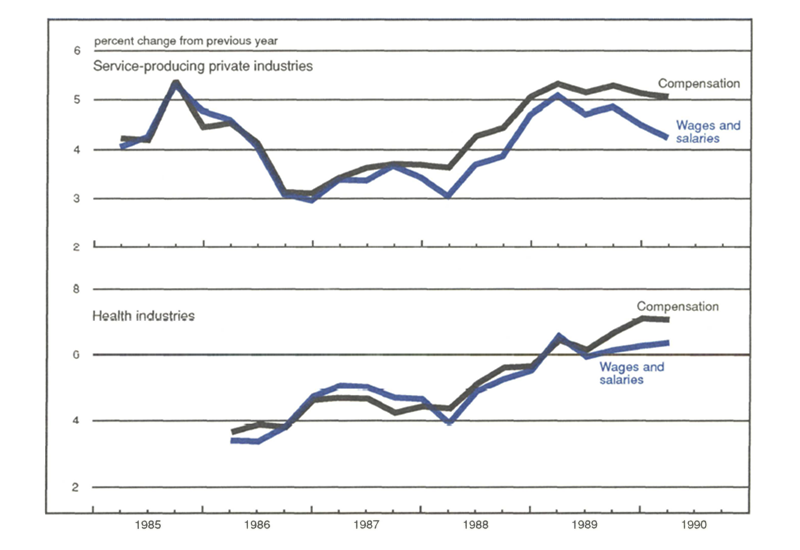
Figure 4 shows wages and total compensations for private service workers, thus excluding state and local government employees, and for private health service workers. As can be seen, private service wage pressures have been easing recently, even though health services wages continue to skyrocket. If health service workers, who are included in the private sector service numbers, were excluded, private service wages would show an even greater fall in growth. The benefits side is still clearly a problem, but this added pressure is a combination of social security taxes and medical insurance costs. The social security tax trend will probably not continue to rise. And the medical insurance costs are just the problem of escalating health care costs in another guise.
4. Service wages are slowing, but not yet in health care
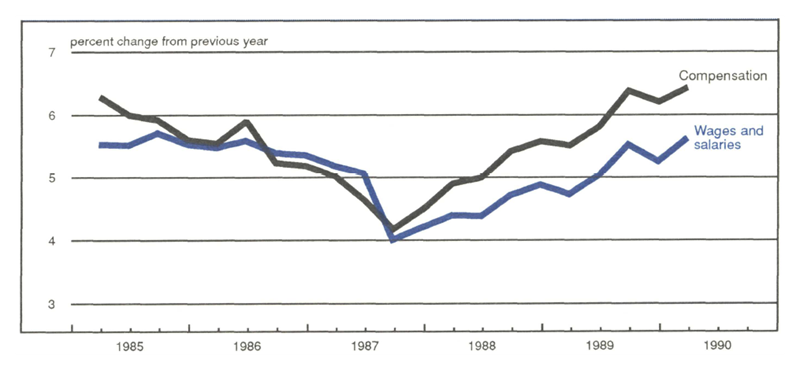
The state and local government sector is the other force pushing up services wages. This sector is heavily dominated by health care and education workers. As figure 5 points out, wages for these workers have been rapidly escalating. Part of this represents, of course, health service workers, but another part is caused by the deliberate public policy in many areas of raising teacher salaries to attract better teachers. If you pay higher wages, labor costs go up.
5. Government wages are still headed up
Thus, in the services sectors where economic factors have reasonable play, wage pressures have declined. However, in those sectors where the normal forces of supply and demand have at best indirect effects, such as in our current health care system and in the government sector, they have not.
There are good reasons for some of the resistance to the usual economic laws. Well-qualified teachers are necessary to maintain the United States’ long-run competitiveness on the international scene. This is a goal worthy of nontrivial sacrifice. Furthermore, these wage pressures will not in all likelihood be a continuing problem; once wages for teachers are adjusted to the desired relative level, education wage increases may be expected to slow. And given the current fiscal situation of most state and local governments, those governments will likely be forced to hold the line on wages sooner rather than later.
The health care system has some special problems. AIDS and the drug crisis have put large and fast-growing burdens on the health care system. New technologies that have saved lives and improved the quality of life for many people are enormously expensive and require highly trained workers. These factors create real costs that society must bear either though taxation or higher medical prices.
Simply put, as new demands are put on the health care system, prices climb. Medical insurance premiums are higher, in part, because insurance now covers a broader, more expensive set of medical treatments. Beyond that, the growing needs of individuals without insurance raise prices. Hospitals must cover their costs. If the government does not directly reimburse the hospitals, the added cost goes into hospital overhead. This higher overhead, in turn, becomes part of the cost of medical insurance.
But the basic problem should not be overstated. Services have not caused a major problem. The Consumer Price Index inflation, less food and energy, in the 12 months ending in May 1990 was 4.7% compared to 4.6% in the 12 months ending in May 1989 and 4.3% in the 12 months ending in May 1988. Services inflation was 5.2%, 5%, and 4.4% for the same periods. Certainly, a somewhat greater increase, but not that much different. Taking health care services out only reduces services inflation to 4.9%, 4.8%, and 4.2%. Inflation simply has not moved very much in any direction since 1983, except for the 1986 oil price collapse.
The bottom line
The services sector is slowing. Those who are depending on services to forestall recession should not rest easy. On the other hand, those who feel that a recession will be necessary to bring services inflation under control should practice patience. Net of health care costs, wage pressures are falling, and the services sector is responding to monetary policy. Like the basketball player who seems to defy gravity, the services sector will come down to earth.
MMI—Midwest Manufacturing Index
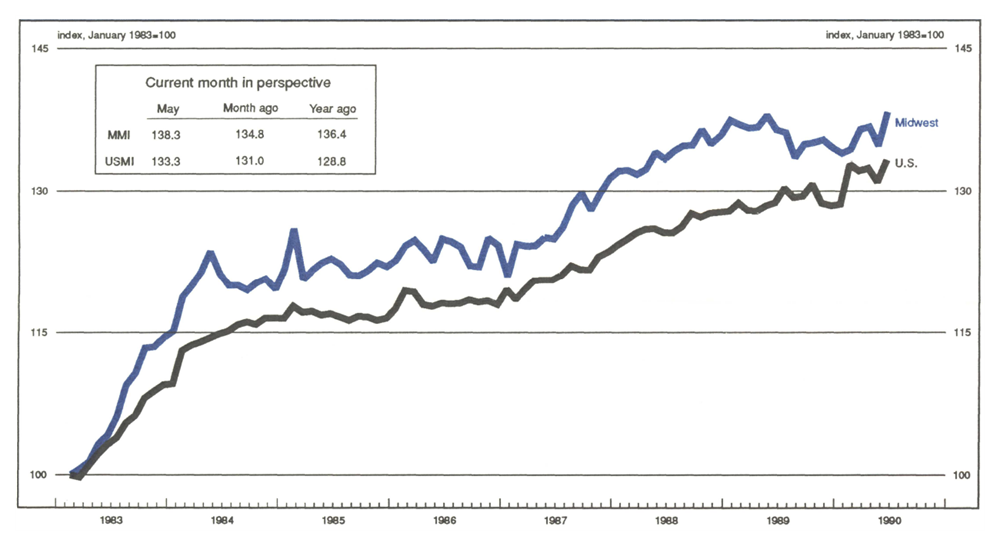
Manufacturing activity in the Midwest rebounded sharply in May from its April slump. After gaining steadily from its most recent low in December, the MMI dropped 1.5% in April. The May spurt in the MMI, up 2.6% from April, in large part represents a return to pre-April activity levels. Gains were concentrated in durable-goods industries, led by transportation and metals.
Over the first four months of this year, the MMI had been lagging the expansion in national manufacturing activity. The growth in May’s MMI put the Midwest slightly ahead of the nation, growing 3.7% regionally since December compared to 3.5% nationally. Once again, gains in auto-related industries provided the margin of difference.


